Web Inspector changes
the toolbar and dashboard are now merged into a tab bar (to save on vertical space)
tightened the spacing around many controls (allowing you to see more content)
Dark Mode variants for all of the icons throughout Web Inspector
possibility to toggle Dark Mode independently from the rest of the system in the Settings Tab
New tabs Sources
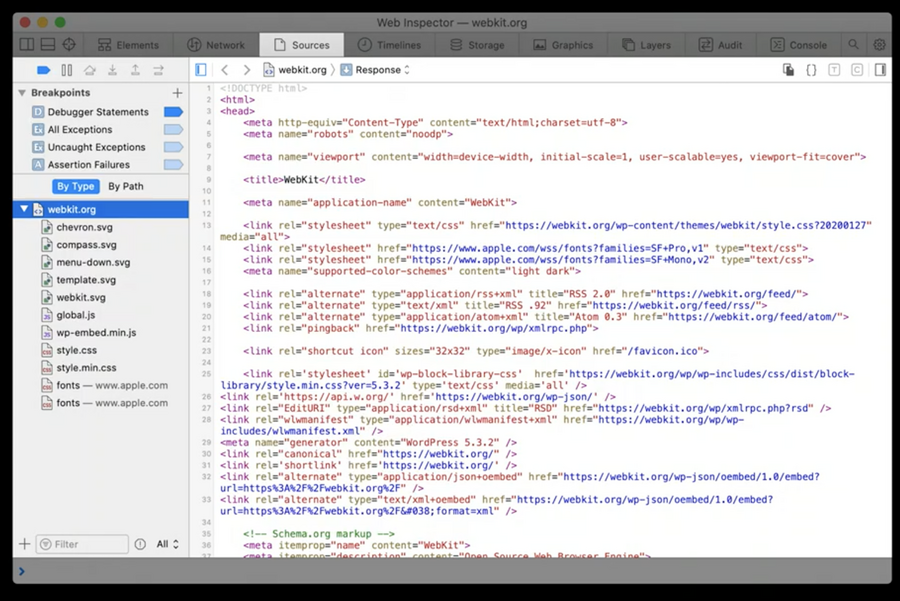
Overview:
lists all resources loaded by the inspected page since Web Inspector was opened, including long-lived things like ‘WebSocket’s or more ephemeral things like XHRs or ‘fetch’s.
primary place for JavaScript debugging, containing all of the JavaScript debugger stepping controls and many of the breakpoint adding capabilities
used for network overriding capabilities
When ispecting a response or part of a request, beside raw, we can also display the content as a
DOM Tree(in case of web sources) orObject Tree(in case of JSON responses)
Local overrides
allow you to modify resources loaded over the network
Clicking the local override button (highlighted above) automatically copies the current contents of the displayed resource into a new local override for that resource.
Once we change the resource, refresh the page and the override will take place
by right-clicking on a local override in Web Inspector, we can select the “Edit Local Override…” action where it’s also possible to modify the HTTP status code or any HTTP headers as well
non-text resources, like images, can also be overridden and fully configured
preserved across sessions of both the inspected page and Web Inspector itself
Inspector Bootstrap Script
we can be add a Inspector Bootstrap Script from the add resource button in the bottom corner of the navigation sidebar in the Sources Tab
it’s a way to modify the JavaScript API surface itself.
The contents of the Inspector Bootstrap Script are guaranteed to run before anything else in the inspected page.
preserved across sessions of both the inspected page and Web Inspector itself
New Javascript Breakpoints
Debugger Statements breakpoint: controls whether or not JavaScript execution is paused at ‘debugger’ statements.
All Microtasks breakpoint: pauses JavaScript execution whenever any microtask is about to be executed (such as from ‘Promise’ objects or the ‘queueMicrotask()’ global function)
All Animation Frames breakpoint: same as above, but for ‘requestAnimationFrame’ callbacks.
All Timeouts breakpoint: same as above, but for ‘setTimeout’ callbacks
All Intervals breakpoint: same as above, but for ‘setInterval’ callbacks
All Events breakpoint: pauses before any callback is invoked for any event listener, even those unrelated to the DOM
Script blackboxing
defers any JavaScript debugger pauses that would occur in a script to pause at the first expression to execute outside of that script.
useful to avoid global breakpoints to stop within jquery for example
Step debugger action
resumes and re-pauses Javascript execution before the next expression in the current call frame
basically a shortcut for Step in and Step outs
Timelane Tab
Overview:
captures activity in the inspected page
plots records based on category
import/export recording
What’s new:
new
Media & Animationstimelinecaptures events related to media elements
captures the lifecycle of CSS animations and CSS transitions
Storage Tab
Overview:
enumerates data stored in the browser (cookies, LocalStorage, IndexDB, ..)
What’s new:
Provides filtering to find specific data
Enhancements on editing and deleting data
New Graphics Tab
replaces the canvas tab
shows preview for all
<canvas>contexts and shaderssupports recording Javascript API calls of
<canvas>contexts(new) lists all web/css animations, CSS transitions
New Layers Tab
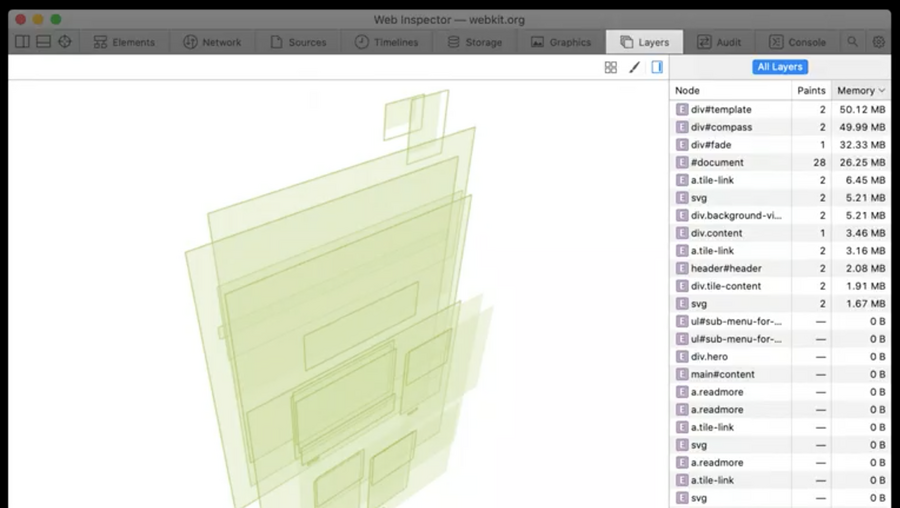
shows a live view of the layer tree of the inspected page
lists the memory cost and the paint count for each layer
Console tab
Overview:
Lists all logs from the inspected page
Allows arbitrary JavaScript evaluation
Exposes special engine functionality
What’s new:
many new console functions:
queryInstances(className)will return an array of all objects that inherit fromclassNamequeryHolders(instanceName)will return an array of all objects in the entire JavaScript heap that have a strong reference toinstanceName
Enable Intelligent Tracking Prevention Debug Mode
new Developer menu option
if active, all debug logging from Safari’s Intelligent Tracking Prevention will appear in the Web Inspector Console, and in the macOS system Console.app
