Key Takeaways
3 new metrics added: CPU instructions, scroll hitches, app exit reasons
Diagnostics functionality provides actionable information targeted to specific events
Recap: How MetricKit Works Today
MetricKit is a tool that provides diagnostics and performance data from users’ devices during beta testing and after release - not during development. This data helps you identify trends and patterns in performance regressions.
Three easy steps to start using MetricKit
Link MetricKit
Instantiate MXMetricManager
Implement MXMetricManagerSubscriber delegate protocol
import MetricKit

class MySubscriber: NSObject, MXMetricManagerSubscriber {

    var metricManager: MXMetricManager?

    override init() {
        super.init()
        metricManager = MXMetricManager.shared
        metricManager?.add(self)
    }

    override deinit() {
        // Apple recommends to remove a subscriber on deinit
        metricManager?.remove(self)
    }

    // this allows you to receive metric payloads
    func didReceive(_ payload: [MXMetricPayload]) {
        for metricPayload in payload {
            // Do something with metricPayload.
        }
    }

}
How the system aggregates and delivers payloads?
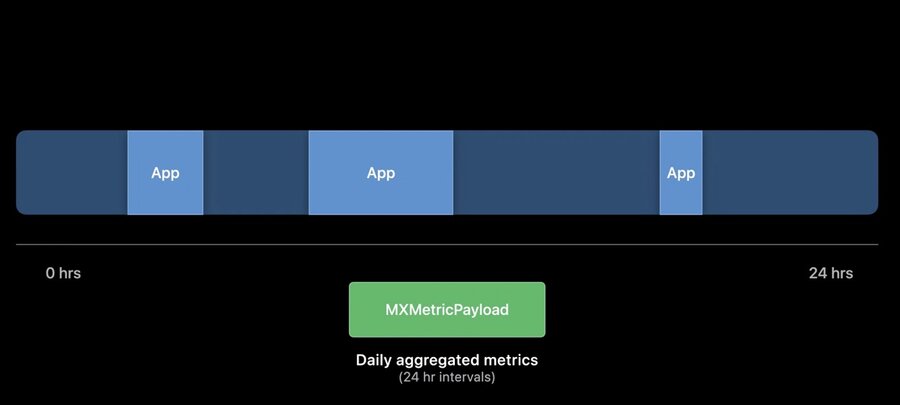
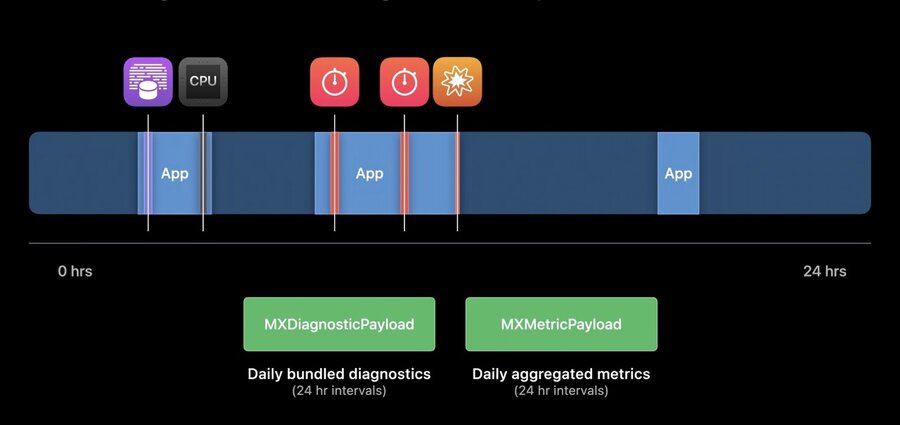
Data is collected passively over a 24‑hour period while the app is running.
At the end of the day, the system aggregates the data into a 24‑hour anonymized payload represented as an MXMetricPayload object.
Understanding Metric Payloads
A payload splits performance data into three aggregation types:
cumulative
average
bucketed performance data
After processing, this data becomes very useful for identifying regressions between builds.
Limitations of Existing Metrics
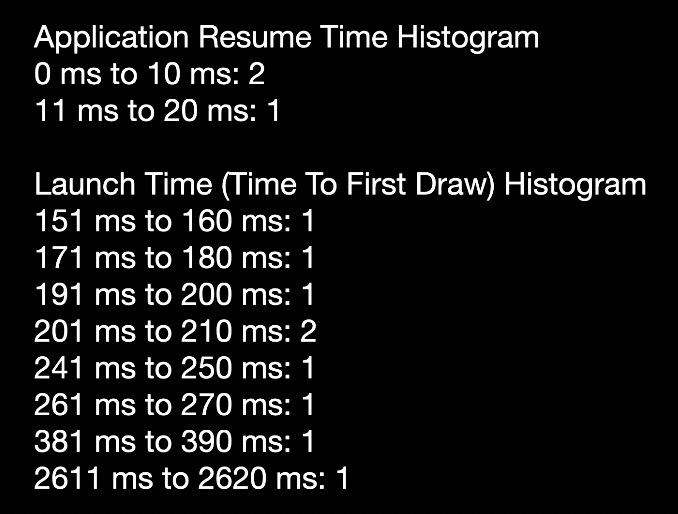
A high number of app launches compared to app resumes may indicate an issue, but existing metrics don’t explain why.
Overall CPU time of 78 seconds vs. 739 seconds of foreground time looks good, but it’s unclear whether this is a regression or an improvement because CPU time depends on hardware frequency.
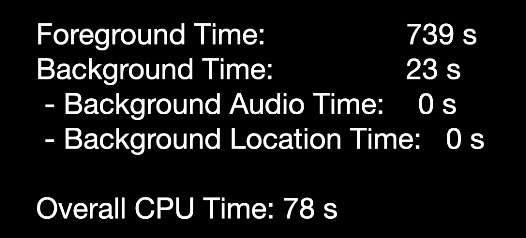
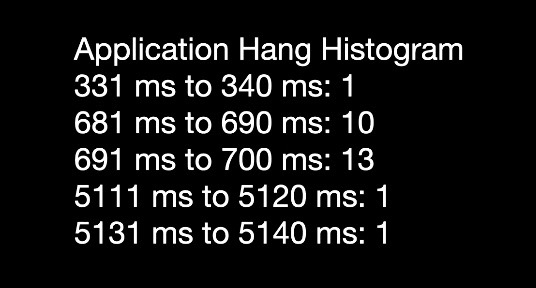
This looks alarming, but there’s no way to investigate the cause.
What’s New in MetricKit 2.0
New metrics added:
CPU Instructions
Scroll hitches
App exit reasons
CPU Instructions Metric
Added to MXCPUMetric
Tracks daily total retired instructions
A hardware‑ and frequency‑independent metric
Represents the total workload of your app
Scroll Hitch Metrics
New metric
A scroll hitch occurs when a rendered frame misses its expected display time during scrolling
Measures user‑perceivable animation delays
Provides a time ratio for UIScrollView scrolling: hitching time vs. scrolling time
See Eliminate animation hitches with XCTest for more technical details about hitches
Application Exit Metrics
Summaries of exit reasons and counts, for both foreground and background
Useful for diagnosing launch issues or problems with background runtime frameworks
For a deep dive, watch Why is my app getting killed
Introduction to MetricKit Diagnostics
Unlike metrics, diagnostics are tied to specific events
Contain actionable, targeted information
To start receiving diagnostics, implement this additional method of MXMetricManagerSubscriber:
func didReceive(_ payload: [MXDiagnosticPayload]) {
    for diagnosticPayload in payload {
        // Consume diagnosticPayload.
    }
}
When you see a regression in a metric payload, you can correlate it with its diagnostic payload

MetricKit 2.0 API
Diagnostic classes mirror metric classes, with MXCallStackTree introduced

MXDiagnostic
Metadata at regression time
Diagnostic‑specific data (unique to each subclass)
Every diagnostic includes an MXCallStackTree
Call Stack Trees
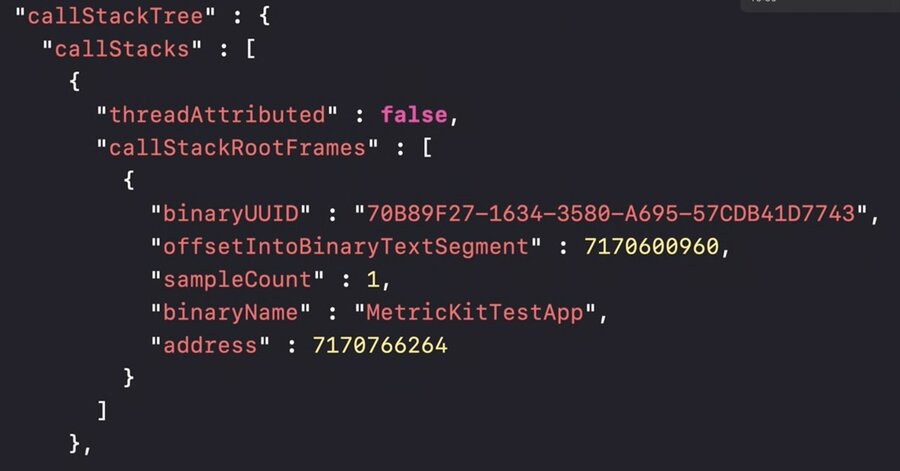
Backtrace captured when the regression occurred
Unsymbolicated - must be symbolicated off‑device using tools like atos
Similar structures are used in other Apple performance tools. See Identify trends with the Power and Performance API
MXDiagnostic Subclasses
MXHangDiagnostic
A hang is long‑lasting app unresponsiveness (e.g., a blocked main thread).
Provided data:
time spent hanging
main‑thread backtrace
MXCPUExceptionDiagnostic
(Displayed as “energy logs” in Xcode Organizer) Provided data:
CPU time consumed
total sampled time
backtraces of CPU‑spinning threads
MXDiskWriteExceptionDiagnostic
Provided data:
total writes caused
backtrace of threads causing writes
generated when the app exceeds the 1 GB daily disk‑write threshold
MXCrashDiagnostic
Provided data:
exception type, code and signal
termination reason
virtual memory region details for bad‑access crashes
backtrace of the crashed thread
