Key Takeaways
👍 Great When Shape of Data is Important
Interactivity is Key
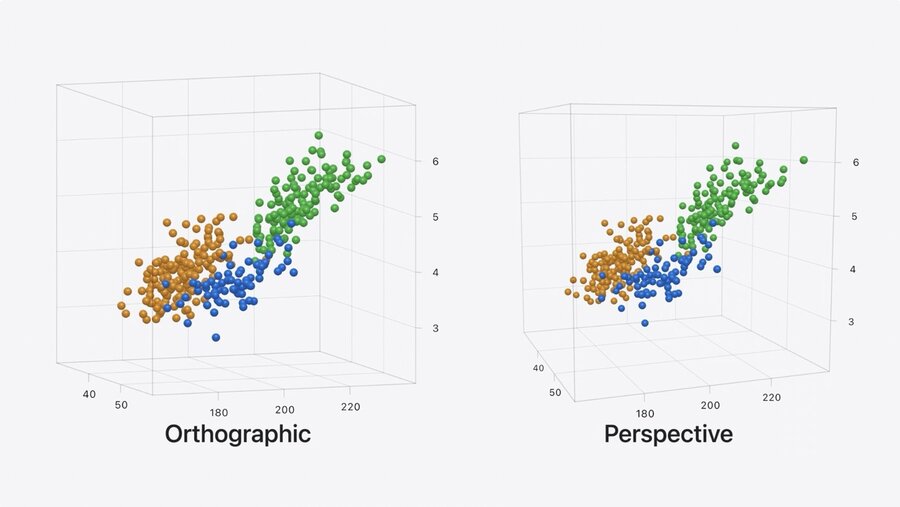
🎥 Orthographic Perspective by Default
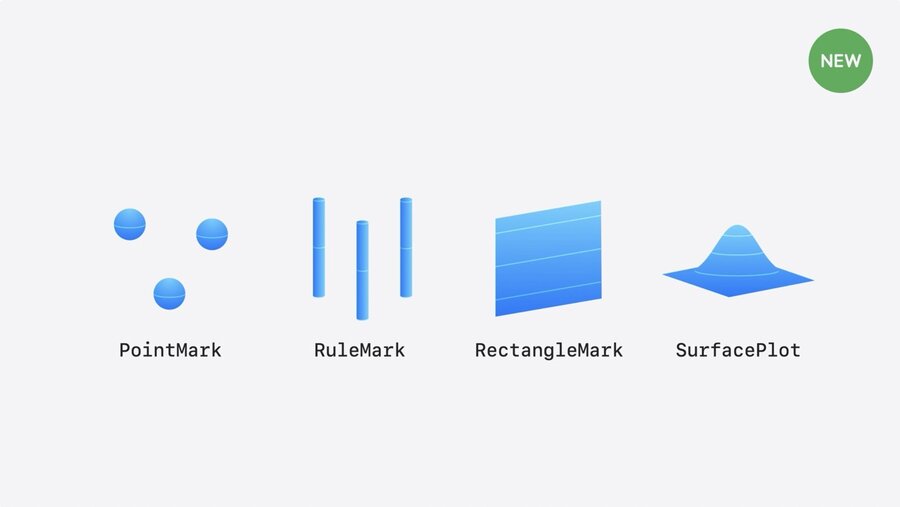
🆕 New Mark Type
SurfacePlot
Plotting in 3D
Used by changing
CharttoChart3DPointMark,RuleMarkandRectangleMarknow support z-valuesNew and unique to 3D charts is
SurfacePlot
Charts support gestures for rotation
Rotation snaps to sides to represent 2D chart
// A scatterplot of a penguin's flipper length, beak length, and weight

Chart3D(penguins) { penguin in
    PointMark(
        x: .value("Flipper Length", penguin.flipperLength),
        y: .value("Weight", penguin.weight),
        z: .value("Beak Length", penguin.beakLength)
    )
    .foregroundStyle(by: .value("Species", penguin.species))
}
.chartXAxisLabel("Flipper Length (mm)")
.chartYAxisLabel("Weight (kg)")
.chartZAxisLabel("Beak Length (mm)")
3D Charts Work Great When
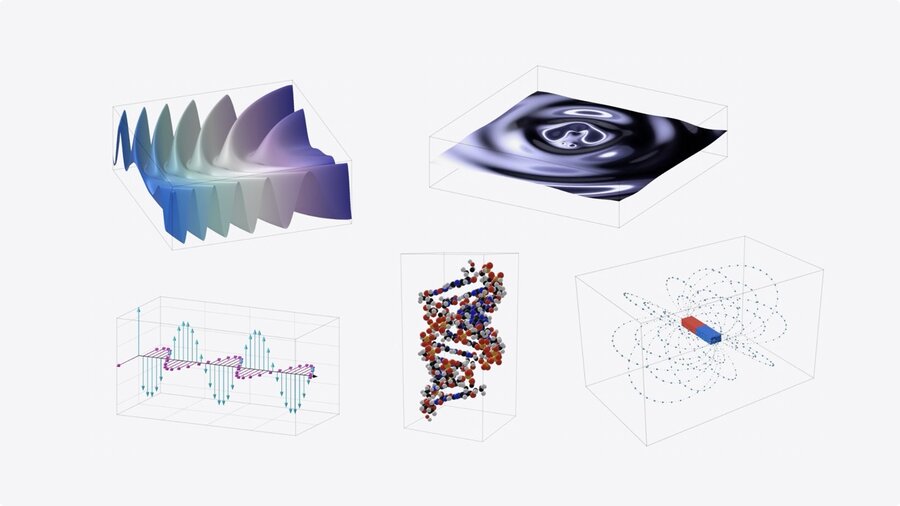
Shape of data is important
Data itself is three-dimensional
Data represents physical position
“Interactivity is key to understanding three-dimensional datasets, so only consider 3D charts if requiring interaction enhances the experience in your app.”
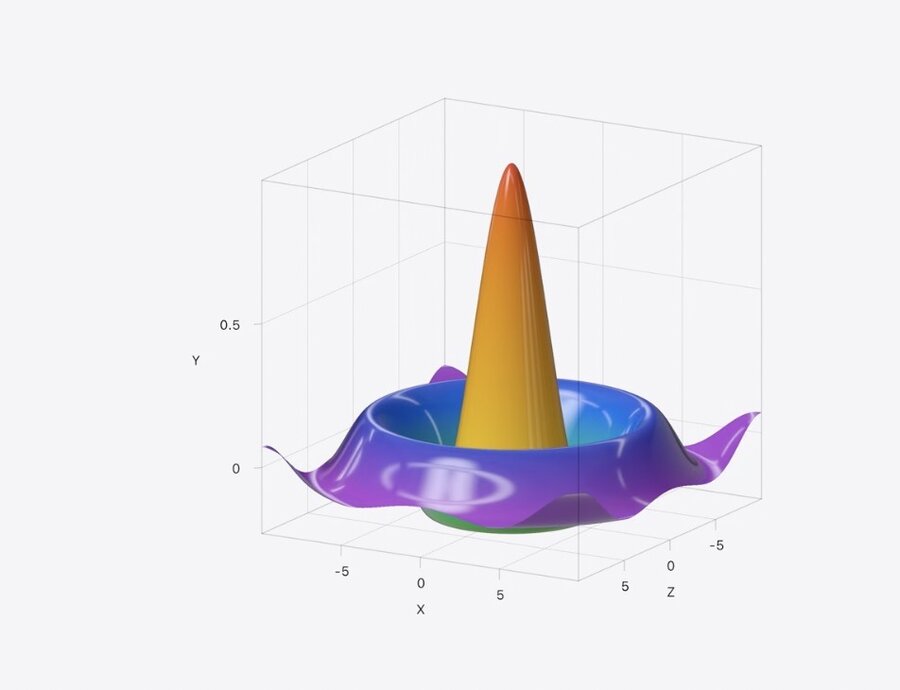
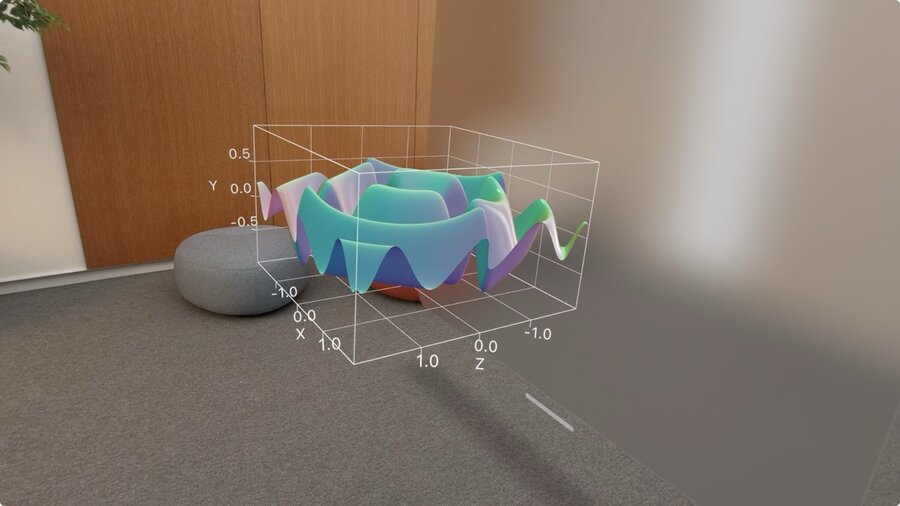
Surface plot
SurfacePlotis similar toLinePlotAPIPlots mathematical surface with up to two variables: f(x, z)
Accepts closure of 2 doubles, and returns a double
Evaluates expression and creates continuous surfaces of computed Y values
Functions simple or complex as you want
Chart3D {
    SurfacePlot(x: "X", y: "Y", z: "Z") { x, z in
        // (Double, Double) -> Double
        (sin(5 * x) + sin(5 * z)) / 2
    }
}
Use LinearRegression to show linear relationships in 3D:
let linearRegression = LinearRegression(
    penguins,
    x: \.flipperLength,
    y: \.weight,
    z: \.beakLength
)

struct PenguinChart: some View {
    var body: some View {
        Chart3D {
            ForEach(penguins) { … }

            SurfacePlot(x: "Flipper Length", y: "Weight", z: "Beak Length") { flipperLength, beakLength in
                linearRegression(flipperLength, beakLength)
            }
            .foregroundStyle(.gray)
        }
    }
}
More on function plots in: Swift Charts Vectorized and function plots
Customization
Camera View
Choose an initial Pose that works well with your data
Chart3DPose accepts standard views, like
.defaultor.front@State var pose: Chart3DPose = .default var body: some View { Chart3D(penguins) { penguin in … ) .chart3DPose($pose) }Custom poses via:
@State var pose = Chart3DPose(
    azimuth: .degrees(20),
    inclination: .degrees(7)
)
Camera Perspective
Uses orthographic camera projection by default
Points in the back are same size as front -> easier to compare
Works best for viewing charts from side
Perspective projection can be enabled via
.chart3DCameraProjection(.perspective)
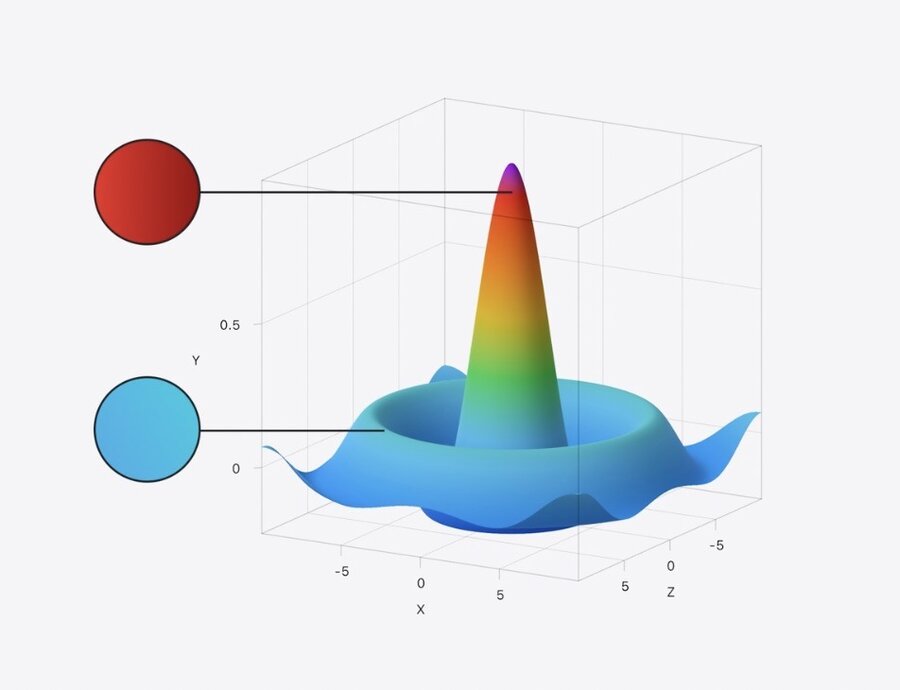
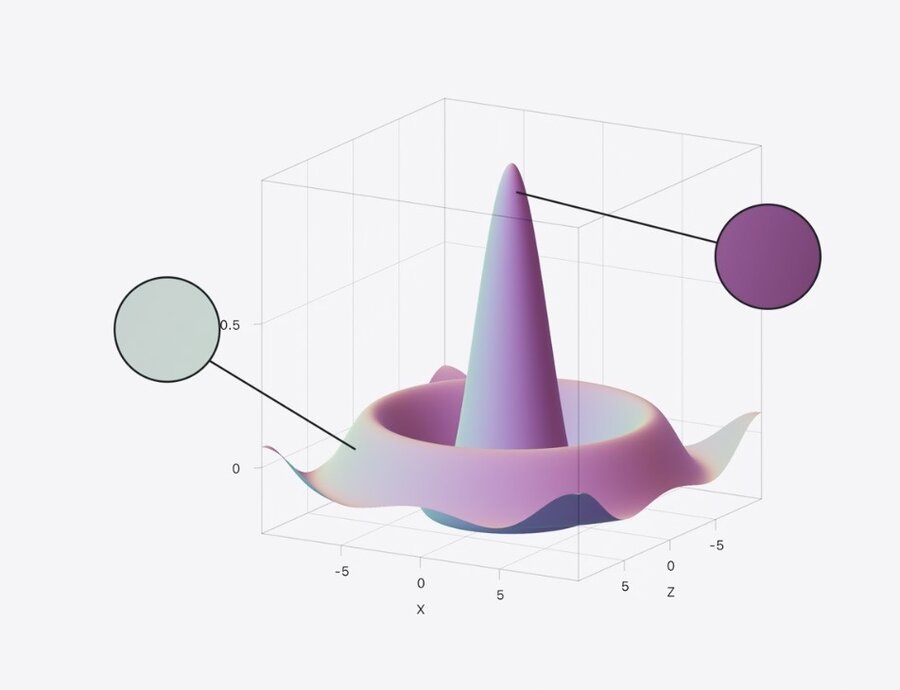
SurfacePlot Coloring
.foregroundStyle accepts:
LinearGradient()EllipticalGradient().heightBased.normalBased