Key Takeaways
Explore Code with Ease
Find bugs faster
Pause program at any time
Inspect variable states
Evaluate expressions
Much more
Presenter
Felipe Piovezan, Debugging Technologies
Getting Started
Define a debugging model
Debugging using crashlogs
Program pausing using breakpoints
Tools -
pcommandData type appearence in debugger
Program Errors
Crash
Incorrect Value
Program Hanging
Somewhere between the start of the program execution, and the point in which the incorrect behavior is observed, faulty code was executed.The bug can usually be found by inspecting the state of the program at different points in time, with each inspection the problematic code being brought closer.
Log Statements
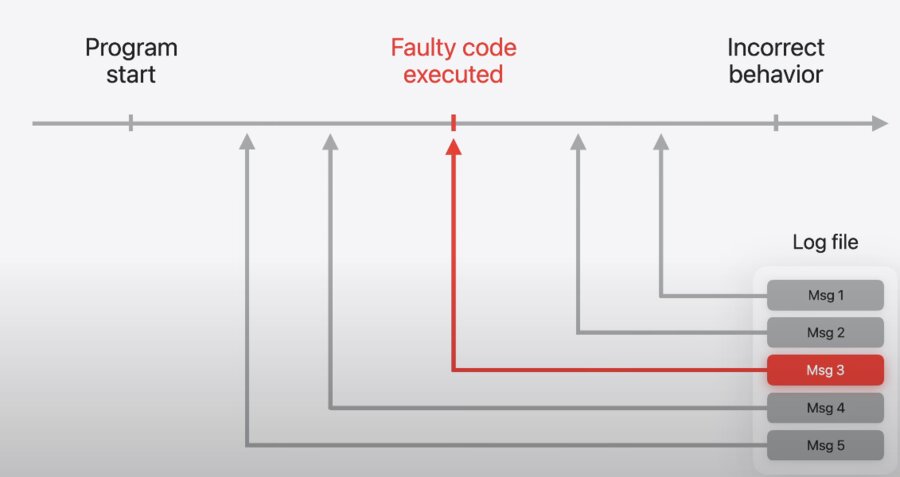
If the log is detailed enough, it may be all that’s needed to pinpoint the bug in the code. This requires foresight by the programer to determine what is useful information to log, but can be a powerful technique to transmit app diagnostics between users and developers.
Print Debugging
print("this string shows in the console")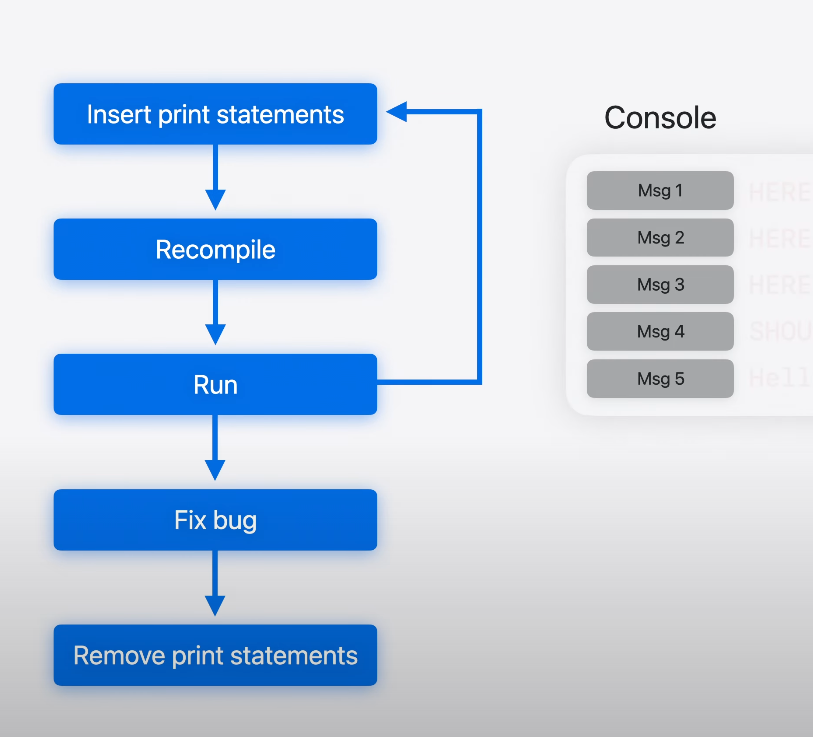
Insert print statements in the code
Recompile
Run
Reproduce bug
Inspect printed statements
Remove print statements
LLDB Tools
Backtraces
Variable inspection
Breakpoints
Expression Evaluation
Repeating the run, break, inspect loop efficiently is key to an effective debugging session
Crashlogs
When a program crashes a log is made called the crashlog. These can be opened by LLDB to potentially find the source of the bug before relaunching the program.
Backtrace
The backtrace describes the sequence of function calls, or stack frames, that led to this program state. It provides a view into what each function was doing, where they were called, and also where each of them was going to return to.
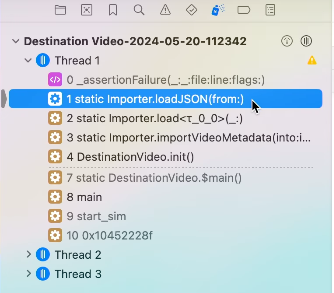
Make sure the project is checked out on the same commit as the version of the app that created the crashlog, and that the dSYM bundle for that build is available. By inspecting the backtrace, confirmations can be made showing the middle of nested calls constructing UI elements.
Breakpoints
Breakpoints observe the line and column information assigning each an ID. The most basic breakpoint can lead to breaking in interesting ways.
Button(action: { watchLater.toggle(video: video) }) {
    let inList = watchLater.isInList(video: video)
    Label(inList ? "In Watch Later" : "Add to Watch Later",
    systemImage: inList ? "checkmark" : "plus")
}
Three separate code regions attributed to the same line, but reached through different code paths:
Constructor Call
Trailing Closure called by constructor
Action Closure called when button is clicked
Breakpoint Actions
The debugger can run commands when breakpoints are reached.
Command Line
LLDB provides detailed description of all of its commands by using the help command.
(lldb) help <command>Any option of a specific command also has help.
(lldb) help <command> <option>More lldb features can be discovered using the apropros command.
(lldb) apropros <keyword>A search for commands related to backtraces finds frame select and its alias, the f command. Also finding the thread backtrace command.
(lldb) apropros backtrace

The following commands may relate to 'backtrace':
    frame select        --Select the current stack frame by index from within the current thread (see 'thread backtrace'.)
    thread backtrace    --Show thread call stacks. Defaults to the current thread, thread indexes can be specified as arguements.
    f                   --Select the current stack frame by index from within the current thread (see 'thread backtrace'.)
Breakpoint Conditions
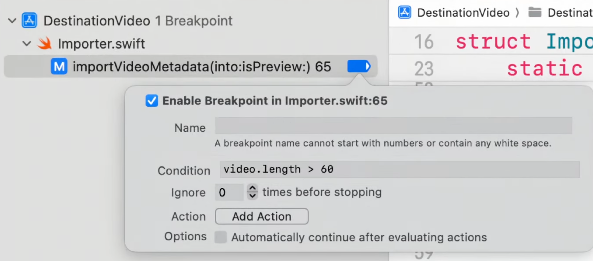
Secondary click on the breakpoint
Navigate to Edit Breakpoint
Populate Condition field
(lldb) break modify <breakpoint ID> --condition "video.length > 60"Breakpoint only stops the program if the current video is longer than 60 seconds.
}
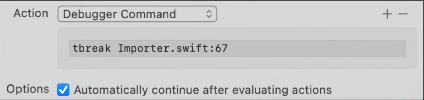
A temporary breakpoint causes the program to stop only once at that location.
```lldb
(lldb) break modify <breakpoint ID> --ignore-count 10
```
Setting a breakpoint inside an if statement that executes only when the condition is true is a performant way.
// High-firing breakpoints

for video in videos {
    if (/*break_condition*/) {
        /*set breakpoint here*/
    }
    if (video.hasRemoteMedia) {
        video.loadRemoteMedia()
    }
    processVideo(video)
}
A nice trick is to use the raise function with the SIGSTOP signal: this instructs the application to stop and, if running it through Xcode or lldb, the debugger will take over as if a breakpoint had been reached.
LLDB Commands
** p Command **
Command for most situations in which you need to inspect a variable or evaluate an expression. Has been reworked as an alias to the “do what I mean” print command.
** Some Other Commands **
po
register read
memory read
target variable
Type Summaries
With Swift 6, the output of p can be customized
Annotate the type with
@DebugDescriptionProvide a
debugdescriptionstring property usingString interpolation
Stored Properties
@DebugDescriptioncan replaceCustomDebugStringConvertibleIf the protocol is implemented with:
String interpolation
Computed Properties You can use the macro
