Heap memory: Any memory allocated by
malloc, either directly or indirectly
Measurement
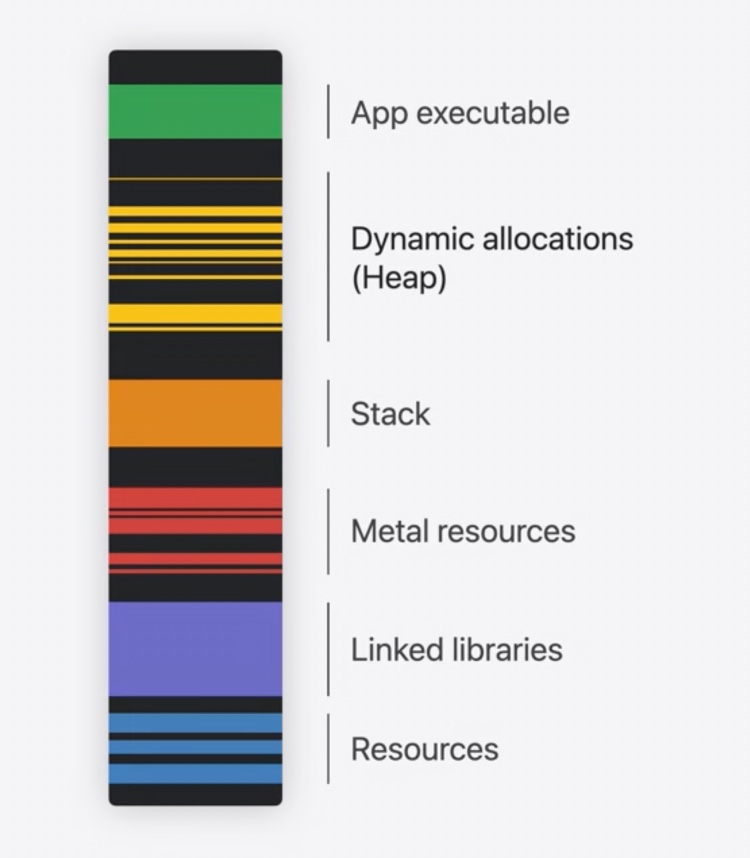
At startup, a process gets its own empty address space of virtual memory
System loads main executable, libraries, frameworks, and other read-only resources
At runtime, a process uses the stack for local and temporary variables
The heap is used at runtime for dynamic and other types of long-lived memory
Focus of this session
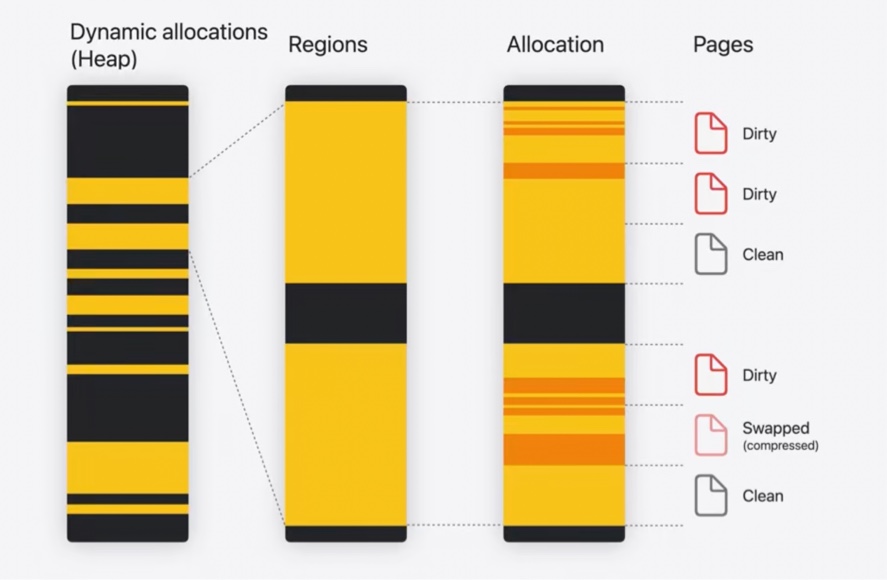
Heap consists of multiple regions as well
Each region is broken up into heap allocations
Each of them is made up of 16KB memory pages
Note: generally, the memory page size is SoC dependent
Individual allocations can be bigger or smaller
Memory pages can be of 3 types:
Clean pages are memory that hasn’t been written to
Allocated but unused
Files mapped read-only from disk
Dirty pages have been written to recently by the process
Can be swapped under memory pressure
Swapped pages are memory compressed or written to disk
When needed, can be decompressed or faulted from disk again
Only dirty and swapped pages count towards memory footprint
malloc
Allow memory to outlive current scope until
free16-byte minimum allocation size
Most small allocations are 0’ed when
freedDebugging features
Stack logging
Track when memory was allocated
Enabled in Scheme Diagnostics tab in Xcode
Xcode memory report
Shows footprint over time
Does not show causes for memory footprint growth
Memory Graph Debugger
Useful for focusing on a specific allocation
Includes backtraces for each allocation when
mallocstack logging is enabledLocated in Xcode debug bar
CLI
leaksheapvmmapmalloc_history
Instruments
Allocations
History of all allocation and
freeevents over time
Leaks
Detects memory leaks
Transient growth
Memory spikes are one type of transient growth
Can mean memory pressure and termination of the process
Can cause fragmentation in heap memory
Allocations template in Instruments is useful for diagnosing memory spikes

Autorelease Pools
Can be a common reason for memory spikes
Used by Objective-C to extend object lifetimes
Autorelease pools delay release of return values until later
Calling into Objective-C APIs from Swift can produce autorelease pools
A loop enclosed in an autorelease pool can autorelease a lot of objects
Lots of objects will be released at once, when the pool is drained
Could define a local autorelease pool for each iteration of the loop
// The outer autorelease pool can autorelease a lot of objects:
autoreleasepool {
    for _ in 1...1000 {
        // Autoreleases into nested pool, preventing outer pool from bloating.
        autoreleasepool {
            print("Now is \(Date.now)")
        }
    }
}
Persistent growth
Memory that doesn’t get deallocated
Increasing footprint over time
In Instruments, use the Mark Generation button to break down memory growth by timespan
Subsequent generations collect persistent allocations made after the previous generation
Snapshots can be viewed in Memory Graph Debugger

Memory leaks
Reachability
Memory must be reachable from somewhere in program to be used in future
3 kinds of memory on the heap:
Useful memory is reachable using non-weak references and can be used again
Abandoned memory is reachable but won’t be used again
Excessive caching or singletons
Still counts towards the footprint
Leaked memory is unreachable and can’t ever be used again
Loss of a pointer through a manually managed allocation
A reference cycle
Leaked memory can be identified using Memory Graph Debugger
Marked automatically
Closure context
Swift closures capture values by allocating memory on the heap
Closure metadata shows up as
[capture]– names are not includedCaptured references are
strongby defaultIf this is a cause for a leak, use
weakorunownedinstead
Runtime speed
Reducing memory can improve performance
Weak references
Always valid to use
Always an optional
Come with overhead: weak reference storage table needs to be allocated
Unowned references
Force-unwrapped
weakNon-optional and constant
More efficient than
weakNot always valid to use
Destination won’t be deallocated while an
unownedreference existsUse
weakif unknown how long destination will live
| - | weak | unowned |
|---|---|---|
| Accessing when destination has been deinitialized | nil (safe) | Crash |
| Memory cost | 32 bytes per destination | None |
Runtime cost compared to strong | ~10x | ~4x |
Performance tips
Managing memory manually or moving to an unsafe language is not always the answer
Turn on whole module optimization to use inlining more aggressively
Ensure struct copies are cheap
Use fewer
anyboxes and reference types in structs
In Objective-C code:
Turning off ARC is not always the answer: bugs can be hard to debug
Use
__attribute__(objc_direct)to allow inliningUse
__attribute__(objc_externally_retained)to eliminateretainandreleasewhen parameter lifetimes are guaranteed
