Presenters
Cheech Minniear, Xcode Design Team
Myke Savage, Engineering Project Manager
Edit
Find the right content
Filter navigators
The left-hand side of Xcode shows navigators. Each giving you a different perspective of your project. The project navigator, for example, shows the project’s file hierarchy.
Use the bottom bar to filter files and folders. After your start typing, and the text matches one of these filters, you’ll see a menu pop-up above the input, offering additional functionality, like filtering by target name. The icons that appear at the right of the bottom bar also change based on the navigator.
Clicking the icon on the far right of the bottom bar, filters the files by git status making it easy to return to files in your upcoming commit, while showing them in the context of your whole project. Try using this filter to easily review changes before committing.
The Find navigator
Command-Shift-F (⌘⇧F) opens Xcode’s Find navigator allowing you to search across your entire project. The bottom bar can be used in conjunction with the Find navigator to filter results.
Holding Command (⌘) clicking on the disclosure arrow to the left of a file name, and collapse all of its siblings. This works on all outline views in Xcode.
Selected files inside the Find navigator can be removed from search results by pressing the Delete key while selected. Note this this only hides the files from the current query, it does not delete the files.
Use the menu beneath the search field to focus the search. You can choose any of the groups containing the file you’re editing. Choose “Custom Scopes…” to pick a different group, or even multiple groups. If you find you’re often using the same search scope, save it and it will show up in the initial menu in the navigator.
Selecting text and then pressing Command-E (⌘E) will insert the text into the Find field without clearing your clipboard. This works in any maxOS app.
Move between files
The tab bar
The tab bar, located towards the top of the source editor, underneath the toolbar. Use the tab bar to switch between documents. Two types of tabs are supported by Xcode, permanent tabs (for the documents you’ve shown explicit interest in) and implicit tabs (which Xcode creates for files you’ve only passed through). You can tell the implicit tab from the others because of its italicized title. Make an implicit tab a permanent tab by choosing “Keep Open” from the context menu, or by double clicking on the tab.
Close multiple tabs simultaneously by Option clicking the close button of one tab to close all other open tabs.
Back and Forward buttons are to the left of the tab bar. Click and hold one to see a full history.
To the left of the Back button is the related filed menu. This menu contains recent files list as well as different types of symbolic relations will appear based on the text: like subclasses of the current class, or callers of the current function.
The three buttons to the right of the tab bar are for configuring the editor UI. The middle button controls the editor layout. You can add a SwiftUI Preview, the editor mini-map, and line accessories like blame or code coverage.
The jump bar
Located just below the tab bar, the jump bar shows the path to the current file. Every step in this path is interactive. Click on an item to view neighboring files. Start typing, and a filter field will appear in the top of the menu. Many menus in Xcode have this functionality. To find an item from the jump bar in the project navigator, press Command-Shift-J (⌘⇧J).
Tricks for creating new files
To create a new file you can right click in the navigator and skip the template chooser. If you want to use the format of an existing file to create a new one use copy & paste or duplicate. Additionally you can hold option (⌥) then click and drag an item to copy it.
Use Command-X (⌘X) to cut the contents of one file to the clipboard. Then right click anywhere in the navigator. Hold option and some of the menu items will change. Choose “New file with contents of clipboard.” Additionally you can paste the content directly into the navigator and Xcode will create the new file for you.
Warnings and error annotations
If you make a mistake in your code Xcode will add an interactive annotation the line with a warning or error. If the annotation contains more info than you’re able to see or if there is more than 1 issue on a line then you can click to show the rest of the information. If the compiler offers a fix-it for the annotation then you may click to apply the fix-it.
Issues will turn gray when you’ve changed the file since the issue last refreshed and will disappear when they are resolved.
You can add your own warnings using the #warning mark along with a message.
Using bookmarks
Right-click anywhere in the editor, to add a bookmark to a line. You may check them off in the bookmarks navigator.
Using Mark comments
Add Mark comments to your file using // MARK: or //MARK: -. The latter will add a visual separator above the comment. Mark comments act as section titles, they appear in the mini-map, and the editor content jump bar segment.
Leverage shortcuts
Open Quickly
Press Command-Shift-O (⌘⇧O) from anywhere, then type in some part of a file or symbol name, and open quickly will immediately give you a list of destinations. It uses code completion-like matching rules, so you can type any of the unique words in your destination name to get there immediately. If you include a slash in the query, you can match file paths instead of file names, and you can end a query with a colon, and the line number, to get to a specific line. Hold Option (⌥) when pressing return to view the files in a split view.
Useful commands and shortcuts
Use Command-Shift-A (⌘⇧A) to open quick actions, where you can do a search of Xcode’s commands with natural language.
You can explore and customize Xcode’s many unique commands by navigating to the Key Bindings tab in the Xcode’s Settings pane.
Command-click invokes “Jump to Definition” and will take you to the definition of a function or type.
Use Option-click to “Show quick help”, and see either the documentation for the clicked symbol, or for Swift variables, to see their inferred type.
Select some text and press Command-Control-E (⌘⌃E) to “Edit All In Scope”. This will allow you to rename a symbol and all of its occurrences in the current file.
You can see all of the callers for the current function by selecting “show callers” when you right click.
Control-M (⌃M) will reformat a function to reformat it to many lines.
Double of a click on one side of a paren, bracket or quote to jump to its matching counterpart.
You can use Option (⌥) and the arrow keys to move by word. And also use Control (⌃) with the arrow keys to move by subword.
Command-Left (⌘←) or Command-Right (⌘→) ares helpful if you’re familiar with pressing Home and End to move to the beginning and end of the line.
Hold Control-Shift (⌃⇧), then click where you’d like to insert multiple cursors to create multiple statements at once.
If you need to put similar code into several places, you can create a template with the same placeholders you see in code completion by surrounding text with these characters: <#placeholder#>.
Code completion
In Xcode 16, predictive completions suggest whole statements and methods based on the surrounding code. These completions appear inline with your code. Pressing the the Tab key to accept what’s shown. Or hold Option to expand the entire prediction. Press Option-Tab to accept the whole thing.
You can hold Option (⌥) when choosing the completion and press Enter to accept all of the arguments.
VIM mode
Toggle in and out of vim mode in the Editor menu. Xcode 16 supports vim’s repeat command as another form of multi-cursor editing.
Common emacs commands
Xcode also supports all of the native macOS text editing interactions, which includes support for many basic emacs commands like:
Control-A (⌃A) for “Beginning of line”,
Control-E (⌃E) for “End of line”,
Control-P (⌃P) for “Previous line”,
Control-N (⌃N) for “Next line”,
along with many others.
Get the most out of git
Show the last change for a line
Right-click and try “show last change for line” to see an overview of the commit for that line. Similar to a focused version of blame.
Changes navigator
Preview an upcoming commit in the changes navigator.
Debug
Setting breakpoints
When things are simple, just click on a line number to add a breakpoint and your program will stop when it gets to that line.
You can use two breakpoints in tandem if the breakpoint would be hit too frequently. Let’s say you have a busy function running constantly, that also runs just after you click a button in your app, and it’s only that one invocation that’s problematic. Add a breakpoint to your button handler, and add a second breakpoint to your busy function. Disable the breakpoint in the busy function by clicking it a second time. When you run your program, hit the breakpoint in your button handler, and re-enable the breakpoint in your busy function then continue. Now you’ll hit that second high traffic breakpoint in just the right state.
Drag breakpoints out to remove them.
You can add a breakpoint to trigger immediately right where any error is thrown by adding a “Swift Error Breakpoint” in the breakpoints navigator
Double click on a breakpoint to open the breakpoint editor. Here you can add specific conditions which trigger then breakpoint when evaluated to true. The breakpoint editor also lets you add debugger expressions to run when the breakpoint is reached.
For example add a print expression, and set the breakpoint to automatically continue. Now you can have temporary logs without rebuilding.
Retroactively pick the expression apart, evaluating parts of it in the debugger with commands like “p session” or even evaluate a conditional to find the cause of the unexpected return.
Drag the green program counter backwards to attempt to re-execute your previous expressions again. Side effects won’t be rewound, so your program may be in an odd state, but if your other choice is to click stop, and restart the debugging session, why not? This could save quite a bit of time.
Disable all of your breakpoints with the breakpoint button in the debug bar,
Use Command-Control-R (⌘⌃R) to “run without building,” skipping the whole build step and getting immediately back to debugging. You can also use this if you’ve started changing your app, but want to debug the old code one more time, and haven’t rebuilt since your last session.
In Xcode 16, you can see full backtraces in the editor, bringing together functions from all over your project into a single editor. This gives you a great overview of how you got to where you are. You can activate this viewing mode in the debug bar, next to the controls for the memory and view debuggers.
Using the console
Marcos (more in the documentation):
#fileID - A unique identifier for the source file in which the macro appears.
#function - The name of the declaration in which it appears.
Consider switching from print to os_log which gives you a debug level for each message that you set. When you run, you can filter by searching for text or filter for just the messages from your library. You can enable metadata to show the type such as error, info, or debug, a timestamp, and the library.
You no longer need those macros in the log messages because you can just jump right to the line in your source where the log message is coming from by clicking the go-to arrow.
Test
Run all of the tests in your project using Command-U (⌘U). To run individual tests click on the diamond for that test function or anywhere up the hierarchy to do a collection of tests.
Test Navigator
Access the test navigator via Command-6 (⌘6) to show all tests. Filter to show “only included tests.” to show only tests in a specific test plan. You may also filter textually for a specific test title or with Swift Testing, you can filter by tag.
Running tests
You select select a test and use the context menu to run the focused set. After running these tests, they’ll have a status. You may focus on specific statuses by filtering.
Command-Control-Option-G (⌘⌃⌥) will rerun the previous tests. Similarly use can use Command-Control-U (⌘⌃U) to “test without building”.
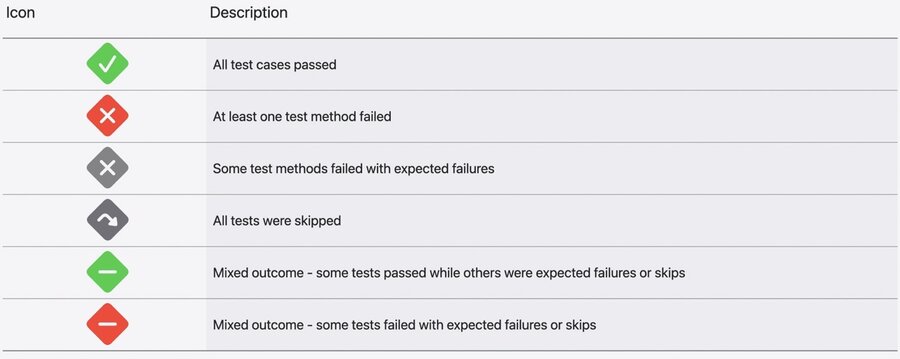
There are several test statues to be aware of including:
A Green diamond with a white check mark meaning “All test cases passed”
A Red diamond with a white X meaning “At least one test method failed”
A Gray diamond with a white X meaning “Some test methods failed with expected errors”
A Gray diamond with a white arrow meaning “All tests were skipped”
A Green diamond with a white minus sign meaning “Mixed outcome - some tests passed while others were expected failures or skips”
A Red diamond with a white minus sign meaning “Mixed outcome - some tests failed with expected failures or skips”
You can “Run test Repeatedly” from a test’s context menu. You can run the test a fixed number of times, or repeatedly until failure.
Run tests from the command line with xcodebuild test. Be sure to specify a scheme, a test plan, or an individual test.
Your developer account comes with Xcode Cloud, bundled for free with 25 compute hours per month. Configure workflows to start testing in the cloud as soon as you push to a certain branch, view the results right inside Xcode, and even configure it to submit directly to TestFlight or App Store Connect when your tests pass.
Xcode Cloud is also secure and private, data is encrypted at rest and access is protected by two-factor authentication. Your source code is only used when building and the build environment is destroyed as soon as your build completes.
Using Test plans
Create groupings of tests to run as desired with Test Plans. Each scheme can have multiple test plans and a test plan can span multiple schemes.
Edit a Test Plan from the Product > Test Plan menu. First, choose which targets to include, such as both our unit tests and UI tests. Then select which tests from those targets to include in this test plan.
You can also add a test plan to multiple schemes by selecting the scheme and then clicking the plus button and “Add existing Test Plan…”. To run your test plan, select it from Product > Test Plan then choose Product > Test or use Command-U (⌘U).
Code coverage
Enable Code Coverage from the Editor menu and then run your tests. After tests have run you’ll see a number on the right side of the editor. This is the number of times that block of code was executed while testing, with 0 meaning that code was never executed.
You can also see an overview of all of your code coverage through the Report Navigator via Command-9 (⌘9).
Explore the Test report
Click on a test run to see a summary of what was tested, or click the Tests item to see just a result of the tests. From either this view or the summary view, double-click on a failed test to see what happened. In the timeline at the bottom, you can see exactly when the failure occurred.
Distribute
TestFlight
Your paid developer account includes TestFlight which allows you to distribute your app to up to 10,000 beta testers. You can either invite them by email or by publishing a link on social media. Beta testers get new versions of your app automatically on their device. TestFlight also works with all platforms.
When you publish a new build, TestFlight includes release notes so that your testers know what to focus on. Testers can provide feedback and analytics to you, which is all built right into Xcode.
Archiving
Publishing your app to either TestFlight or the App Store begins with an archive (a snapshot of your compiled app containing a release build).
This is a release version which is optimized to save space so it no longer includes the debug information you would need to look into issues. The debug symbols are also included in an archive so if you save them, you can debug that version later.
This also allows you to distribute your app by repackaging the contents for whichever destination you choose.
Go to the Product menu and choose Archive to ship your build, results will be located in the Organizer.
Click the Distribute App button to distribute your app. You’ll be presented with several presets for distributing your app. The “App Store Connect” option uploads your app to either TestFlight or App Store Connect.
“TestFlight Internal Only” skips App Review and includes protections so that you cannot accidentally submit it to the App Store. This can only be used for beta testers in your content provider/organization and not external testers.
The “Release Testing,” “Enterprise,” and “Debugging” options all produce optimized builds to be installed by users with devices registered on your portal.
You can setup a workflow using Xcode Cloud to submit directly to TestFlight when your build is successful and your tests pass. You can also configure scripts to automate your tester notes by pulling from your git commit messages.
Explore the Organizer
Command-Option-Shift-O (⌘⇧⌥) opens This Organizer. You may view analytics in a way that preserves the user’s privacy and is built right into Xcode. Only users who consent to sharing feedback and diagnostics with third party developers like you will be displayed.
The Feedback tab contains the feedback provided by your TestFlight beta testers. The launches organizer displays information about your app’s launch such as the amount of time it takes to launch. Remember that your user’s environment may be different than yours.
