Key Takeaways
Profile a release build, not a debug build
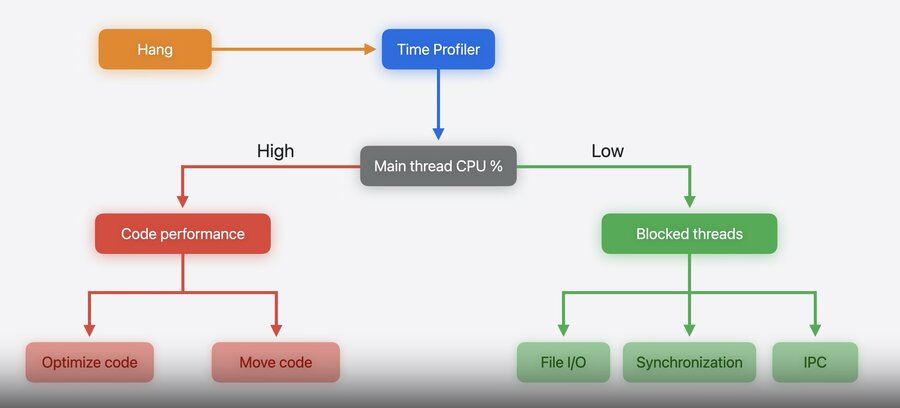
CPU high means a code bottleneck, low means blocking
Move heavy or blocking work off the Main Actor
Presenters
Artem Razvodov, Xcode Team
Harjas Monga, Instruments Team
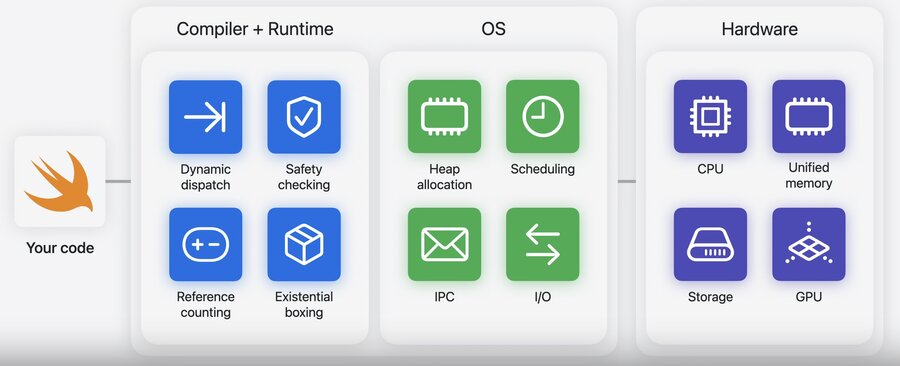
Abstraction layers
Your Swift executes across layers, and a bottleneck can live in any of them
Profiling gives visibility across the whole stack, so you can find which layer is slow
Diagnostic flow
A debug build trades runtime performance for debuggability, so its data can be misleading — profile a release build to get the most actionable data
CPU saturation: investigate periods of high system utilization
High CPU during a hang means the thread is busy and the work is taking too long → a code performance bottleneck
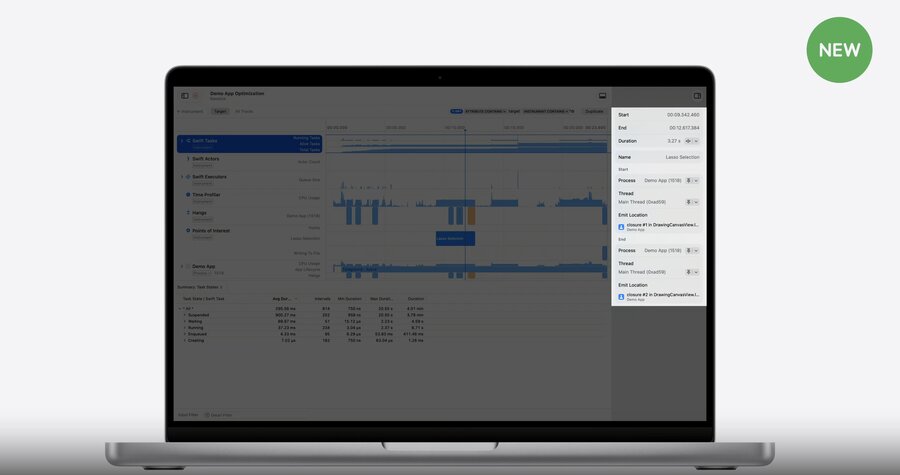
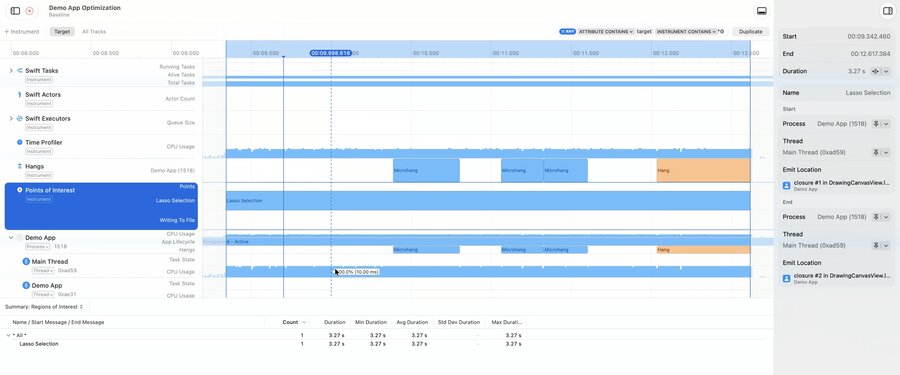
Mark regions of your code with
OSSignposterso Instruments surfaces them in the Points of Interest trackbeginInterval/endIntervalbracket a region (e.g. a “Lasso Selection”)Set
subsystemto your app andcategory: .pointsOfInterestso the data shows up automatically
Instruments 27 adds a new Inspector panel on the right that surfaces details and actions for whatever you select in the timeline or detail view — e.g. a signpost interval’s metadata, a system call’s arguments and cost, or actions like pinning the main thread.
import os.signpost

let signposter = OSSignposter(subsystem: "Demo App", category: .pointsOfInterest)
var lassoIntervalState: OSSignpostIntervalState? = nil

func lassoSelectionUpdated() {
    lassoIntervalState = signposter.beginInterval("Lasso Selection")
    // Update selection in canvas…
}

func lassoSelectionEnded() {
    // Finalize lasso selection...
    signposter.endInterval("Lasso Selection", lassoIntervalState!)
}
Find the interval in the timeline, then use its context menu to filter the trace to that period
Check the main thread’s CPU — if it stays near 100%, your code is running but taking too long → dig in with Time Profiler
Sampling data visualization: interpret profiling data
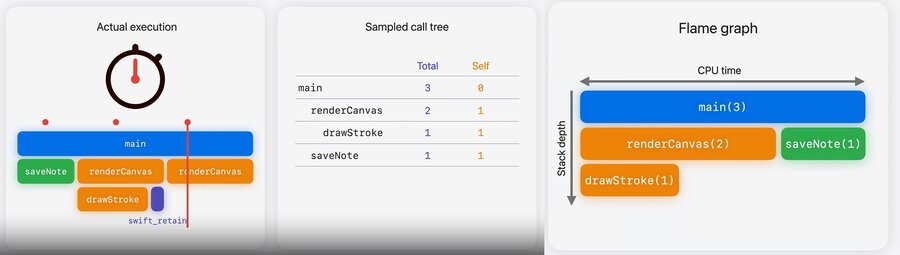
Time Profiler samples the call stack at a regular interval (default 1 ms) on every core; each function is weighted by how many samples it appears in
Call tree & flame graph
The call tree is the raw data driving your investigation
The flame graph maps that tree into spatial blocks
Vertical axis: the call stack (callers on top, callees growing downward)
Horizontal axis: total CPU time (aggregated, not chronological)
The wider the bar, the more samples → instantly spot expensive code paths
Top functions
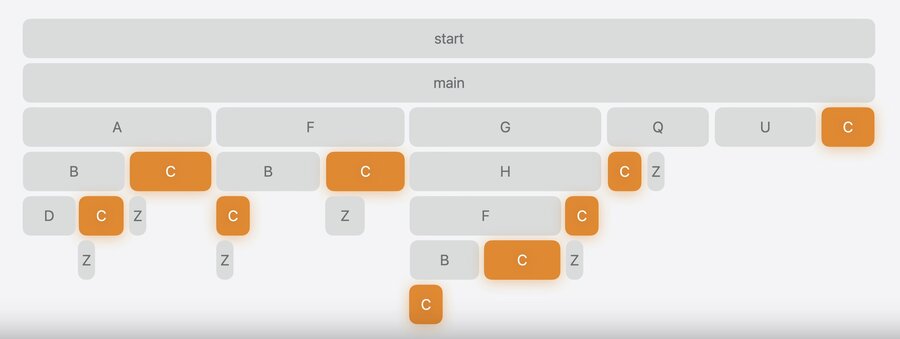
A function called from many places has its cost fractured into small pieces scattered across branches → hard to tell which functions burned the most cycles
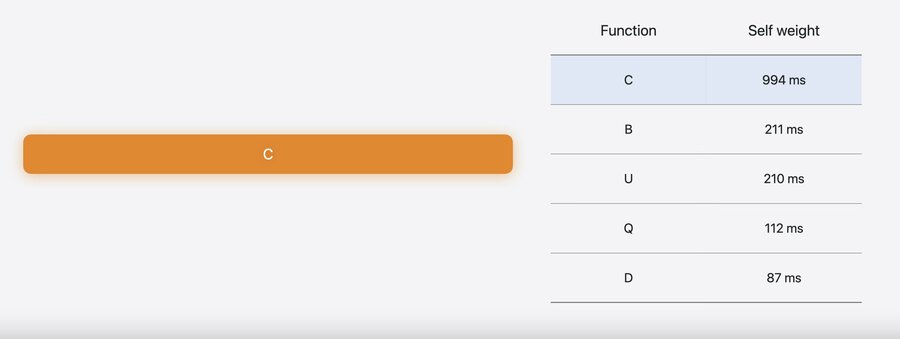
The new Top Functions mode discards the call hierarchy and merges every scattered node into one block
Left: functions sorted by self weight; Right: flame graph of all paths that called the selected function
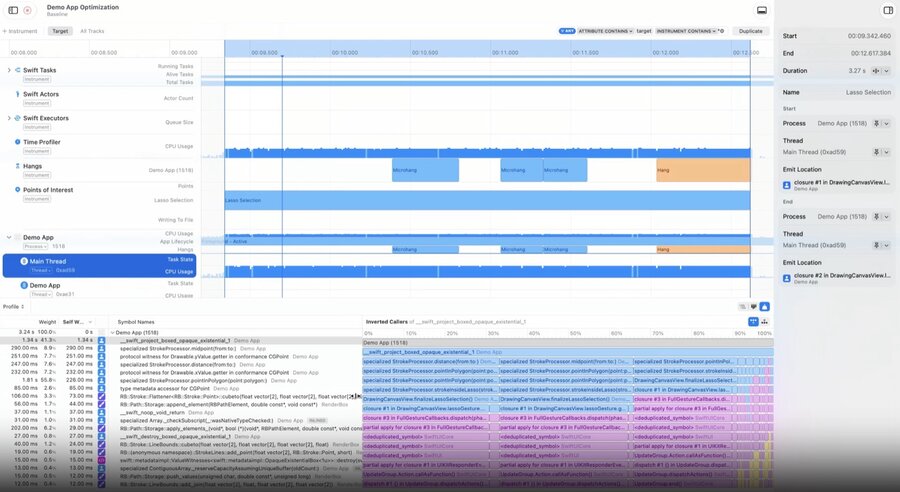
Example: the top function was
swift_project_boxed_opaque_existential— a runtime call that unwraps an existential (anyprotocol type)Existentials can hold any conforming type, so their varying size needs extra work to access → expensive when performance is paramount
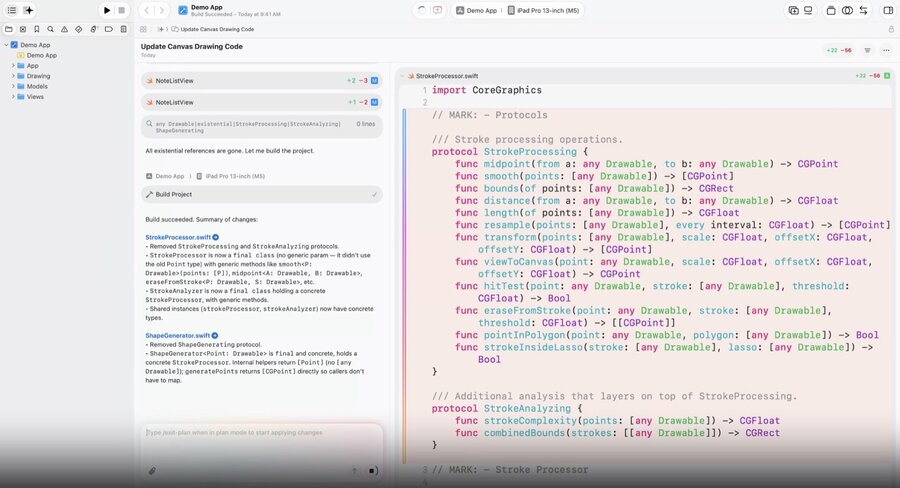
Prefer concrete types, generics, or enums → gives the compiler more information for better optimizations
Run comparisons
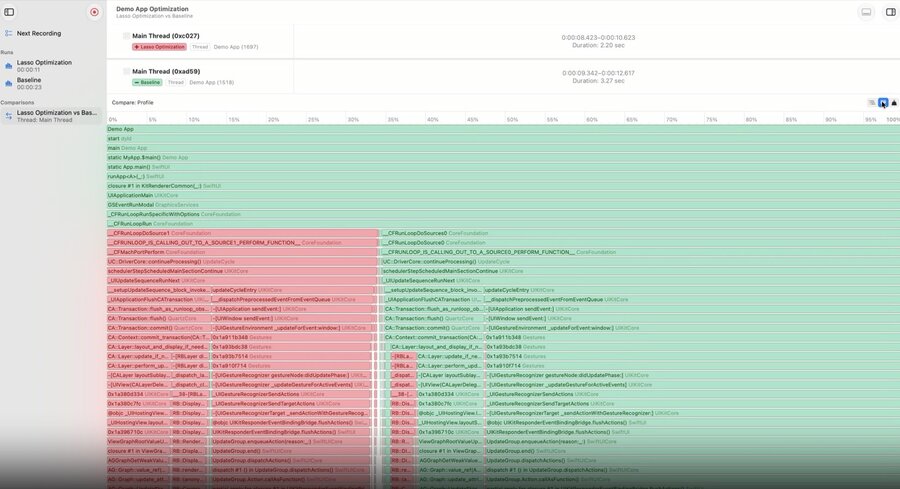
New in Instruments 27 — compare a baseline run against an optimized run to verify improvements
Filter both runs to the same interval (e.g. via a signpost), pick the track, then compare
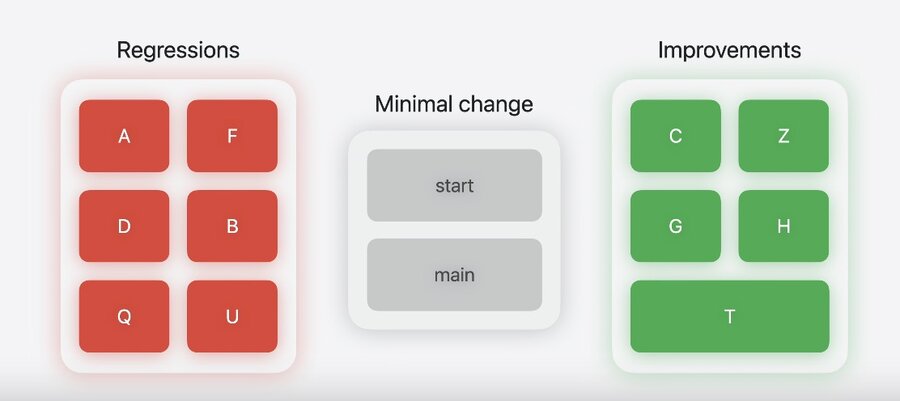
Flame graph: green = improvements, red = regressions; Top Functions shows what improved/regressed most
Execution contention
Tasks are starved for resources — they compete for the same executor (e.g. the Main Actor) and can’t run smoothly
The new Swift Executors instrument visualizes the Main Actor, the global concurrent executor, and any custom executors
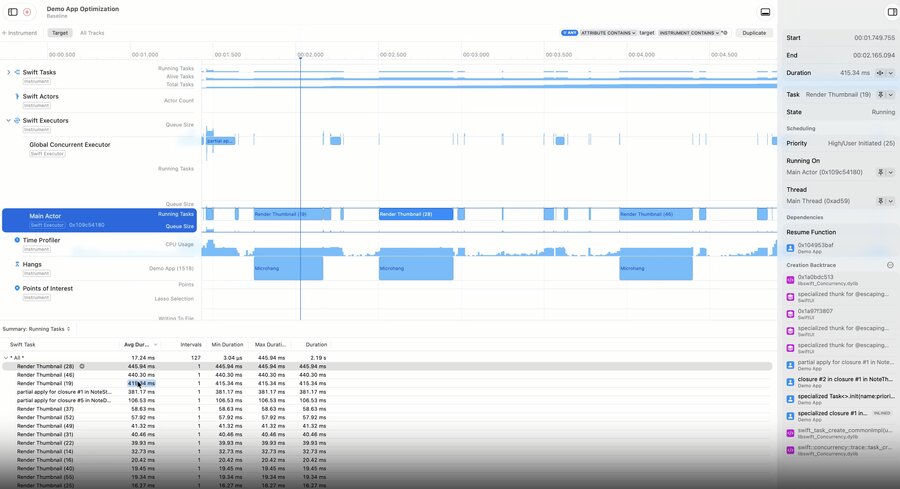
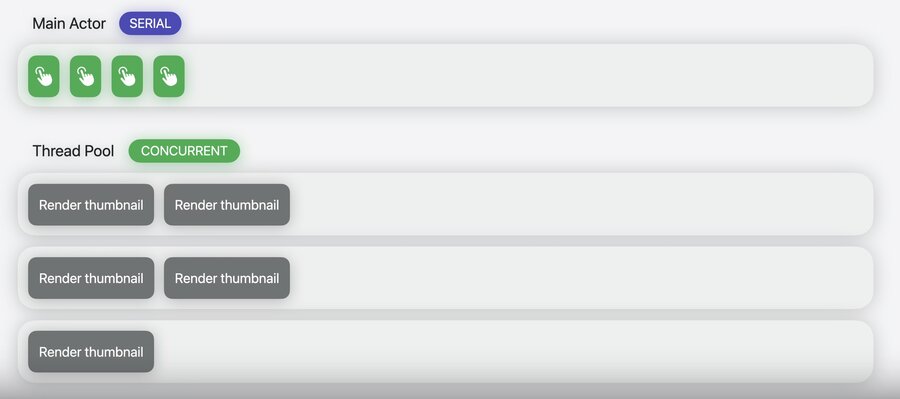
Problem: thumbnail rendering tasks inherit the Main Actor and compete with critical UI updates → hangs
Fix: add
@concurrentto route the work to the global concurrent executor → off the Main Actor, and rendered in parallel

// Before: Thumbnail rendering (runs on the Main Actor)
let drawingData = note.drawingData
let canvasImages = note.decodeCanvas()
thumbnail = await Task(name: "Render Thumbnail") {
    await renderThumbnail(drawingData: drawingData, canvasImages: canvasImages, size: CGSize(width: 300, height: 240))
}.value

// After: Thumbnail rendering off the Main Actor
let drawingData = note.drawingData
let canvasImages = note.decodeCanvas()
thumbnail = await Task(name: "Render Thumbnail") { @concurrent in
    await renderThumbnail(drawingData: drawingData, canvasImages: canvasImages, size: CGSize(width: 300, height: 240))
}.value
System blocking
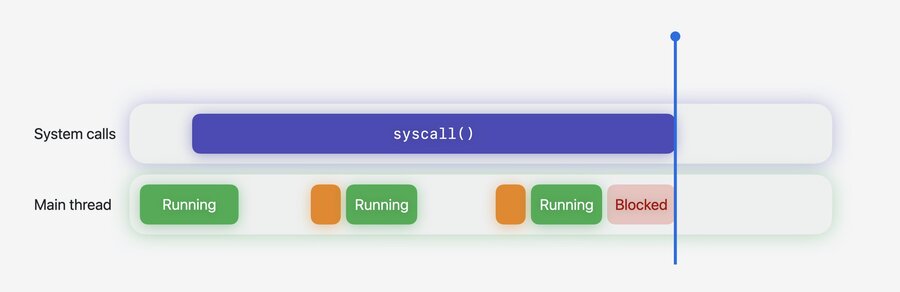
The app stops processing while the main thread waits on a system resource (I/O, locks, IPC) → low CPU, not busy
System Trace visualizes thread state transitions: running → blocked (kernel evicts it) → runnable (resource ready, waiting for a core) → executing
Opaque = on-core running, translucent = blocked off-core, purple = system calls
Use the Inspector to see what a syscall is waiting on (file descriptor, buffer, size, on/off-core cost)
Fix: move blocking work (e.g. a synchronous file write) into a background
Task { @concurrent in … }so the main thread stays responsive