
Key Takeaways
MetricKit collects on-device metrics and diagnostics to find issues
New MetricManager API delivers daily metrics and instant diagnostics
StateReporting breaks metrics down by app state for context
Presenters
Yonni Luu, MetricKit Engineer
Introduction to MetricKit
MetricKit gives insights into the quality of app’s experience
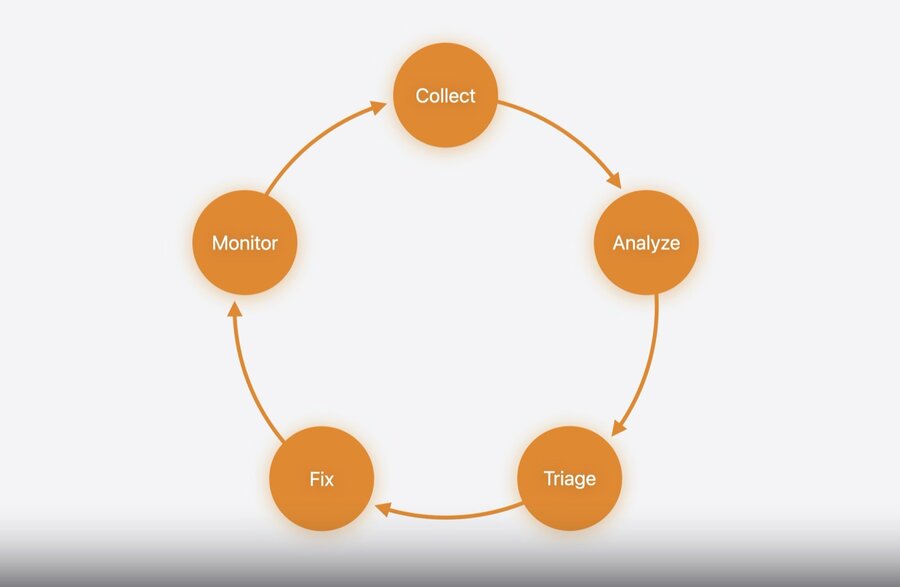
Performance optimization is a loop:
collect data → analyze to find problems → triage the root cause → fix → monitor → repeat.
MetricKit is the data-collection piece of that workflow
Provides two types of data:
Metrics: an app’s ongoing health signal → whether an area of performance is improving or worsening overall
Diagnostics: which code path is causing a specific performance problem
1. Metrics
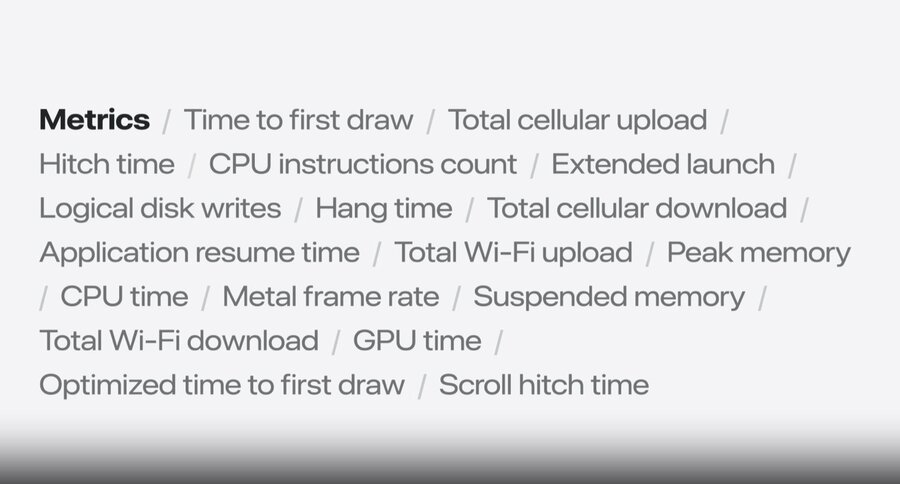
Cover launch time, hangs, animation, and resource use (CPU, GPU, disk writes, network)
New in iOS 27:
Each metric is delivered as a function of the app’s state → contextualized metrics
Metal frame rate: metric for game and rendering performance
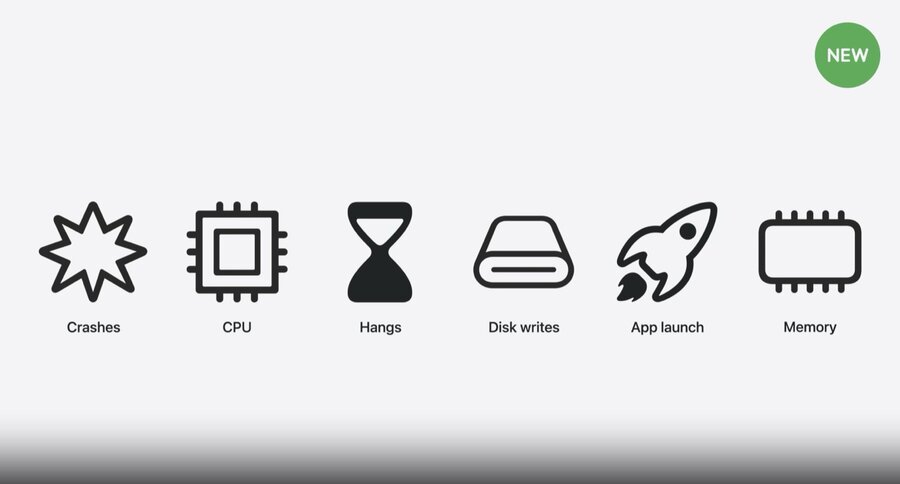
2. Diagnostics
Cover crashes (with symbolicated backtraces), CPU exceptions, hangs, and disk-write exceptions
New in iOS 27:
memory exception diagnostics: when an app exceeds its memory limit
Metric report
Retrieve metrics
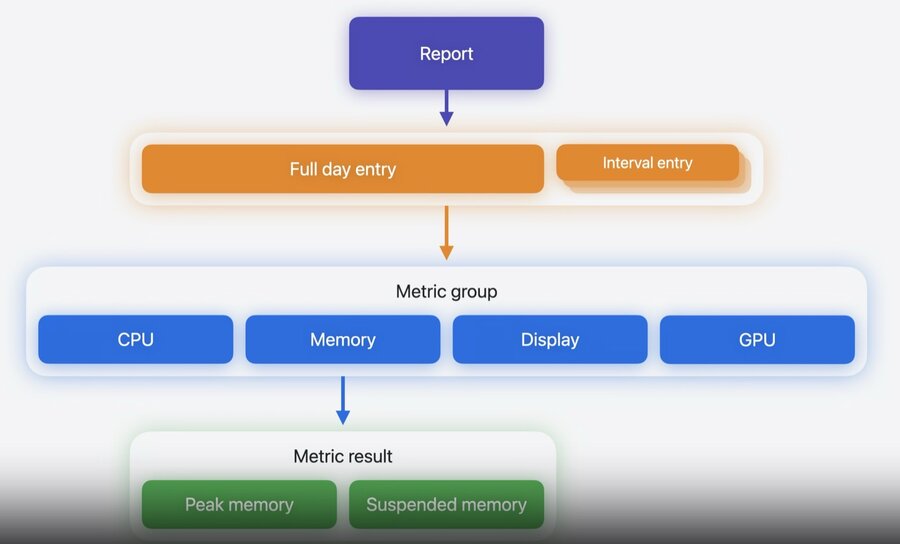
As people use the app throughout the day, MetricKit continuously collects metrics (app launches, hangs, memory, CPU) and delivers them in a daily report
A report contains:
one entry spanning the full day of usage (
fullDayEntry)separate smaller breakdown entries, typically a few hours each, present only when there are metrics associated with them
Inside each interval, metrics are organized into metric groups, each representing a system aspect
.cpu/.memory/.display/.gpuwithin a group you find the individual performance metric results
Use
MetricManagerand itsmetricReportsasync sequence to receive reportsReports are
Codable, so they are easy to encode (e.g. JSON) and send to a server
Set this up at app start-up (in a detached task or dedicated service) to avoid data loss from a delayed subscription, and keep the MetricManager alive so the stream can keep delivering reports.
import MetricKit

let manager = MetricManager()

// Receive metrics from MetricKit
for await report in manager.metricReports {
    processReport(report)
}

// Send metrics to the server
for await report in manager.metricReports {
    let jsonData = try JSONEncoder().encode(report)
    sendToServer(jsonData)
}

// Access your performance metrics (particular group of metrics or a particular value)
for await report in manager.metricReports {
    let intervalEntries = report.intervalEntries
    let fullDayEntry = intervalEntries.fullDayEntry

    for entry in intervalEntries {
        let memoryMetrics = entry.values.filter { $0.metricGroup == .memory }

        for metric in memoryMetrics {
            switch metric {
            case .peakMemory(let peak):
                processPeakMemory(peak)
            default: break
            }
        }
    }
}
Analyze metrics
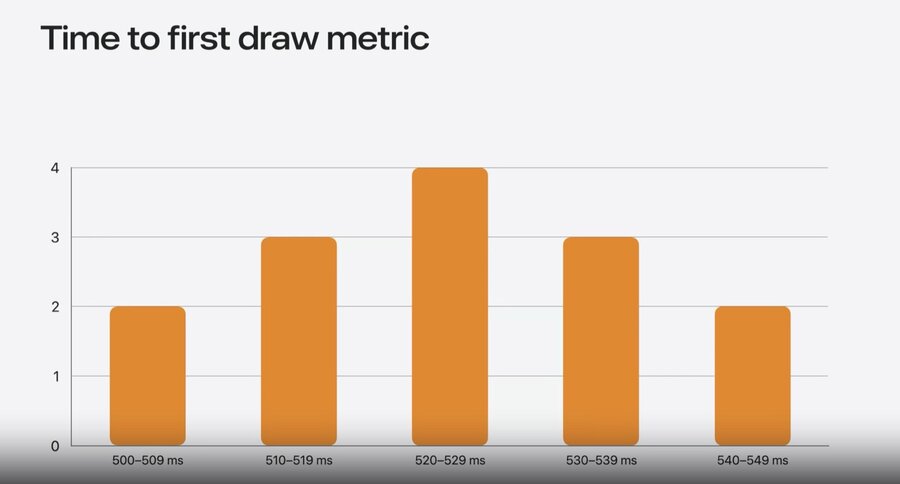
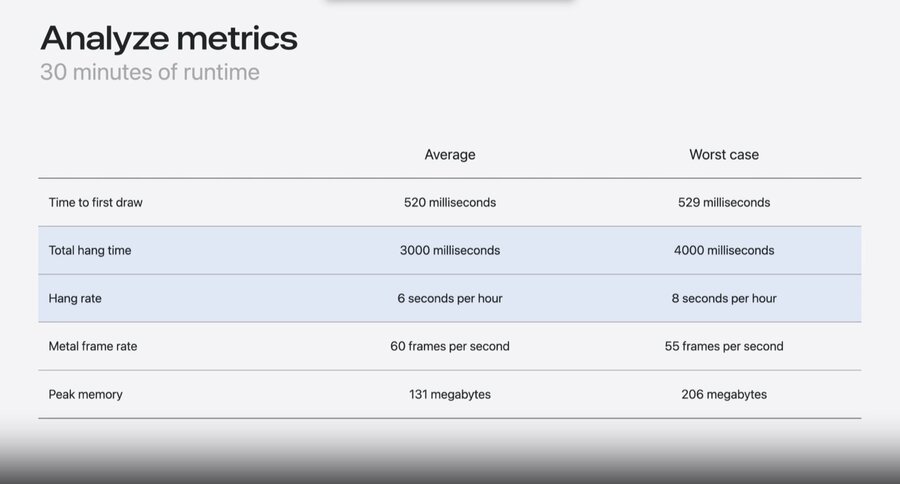
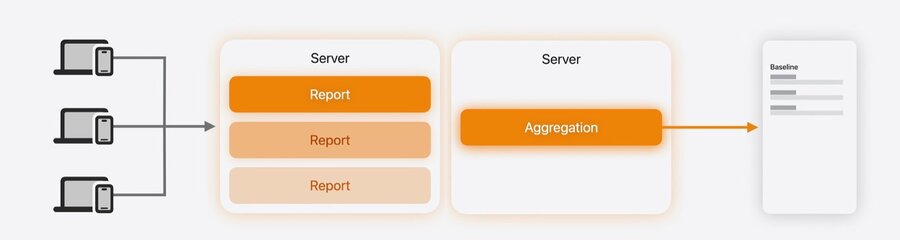
Analyzing metrics across all devices is a data science problem
Set up a server that can ingest each report and aggregate them by the dimensions you care about
Decide the best statistical analysis for the data and insights you want
The custom aggregation gives you a baseline for how the app is already performing
Monitor the aggregated metrics to detect when things get better or worse
Diagnostic report
Diagnostics are most helpful in the triage phase, after collecting metrics and monitoring performance over time
When something goes wrong (a crash or a hang), the system captures a diagnostic on device and delivers it to the app immediately through MetricKit
A diagnostic report packages up the details to triage the issue, including a backtrace that shows the exact call stack at the time of the event
Crash diagnostics also indicate why the app was terminated and an exception type describing the kind of failure
New in iOS 27:
A termination category indicates how each crash was accounted for in metrics, so trending abnormal terminations can be correlated with individual diagnostics
Memory exception diagnostics give insight when the app or extension is terminated for exceeding its memory limit
Receive diagnostics by awaiting
MetricManager’sdiagnosticReports, then switch onreport.result(.crash,.hang)

import MetricKit

let manager = MetricManager()

// Receive diagnostics
for await report in manager.diagnosticReports {
    processReport(report)
}

// Send diagnostic data to the server
for await report in manager.diagnosticReports {
    let jsonData = try JSONEncoder().encode(report)
    sendToServer(jsonData)
}

// Access diagnostic data
for await report in manager.diagnosticReports {
    switch report.result {
    case .crash(let crash):
        let backtrace = crash.callStackTree
        let reason = crash.terminationReason
        let category = crash.terminationCategory
        processCrash(backtrace: backtrace, reason: reason, category: category)
    case .hang(let hang):
        processHangDiagnostic(hang)
    default: break
    }
}
Contextualize data
Default metrics/diagnostics are app-wide averages, which hide where a problem actually is
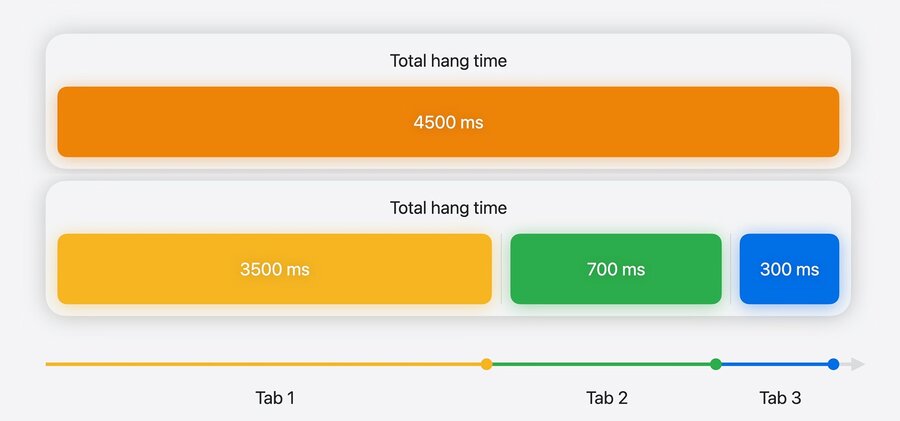
New StateReporting framework: report the app’s state so MetricKit aggregates metrics per state
e.g. a blended scroll hitch of 15 ms/s splits per tab into Spending 1 ms/s vs Reports 71 ms/s
StateReporting framework
State: info you define describing the app’s configuration or behavior
Transition model: the app reports the state it moves to, and MetricKit tracks time spent there (no start/end pairs)
Domain: an app area holding one active state at a time. Use separate domains to track things in parallel (e.g. tab vs experiment batch size), and MetricKit delivers separate metrics for each
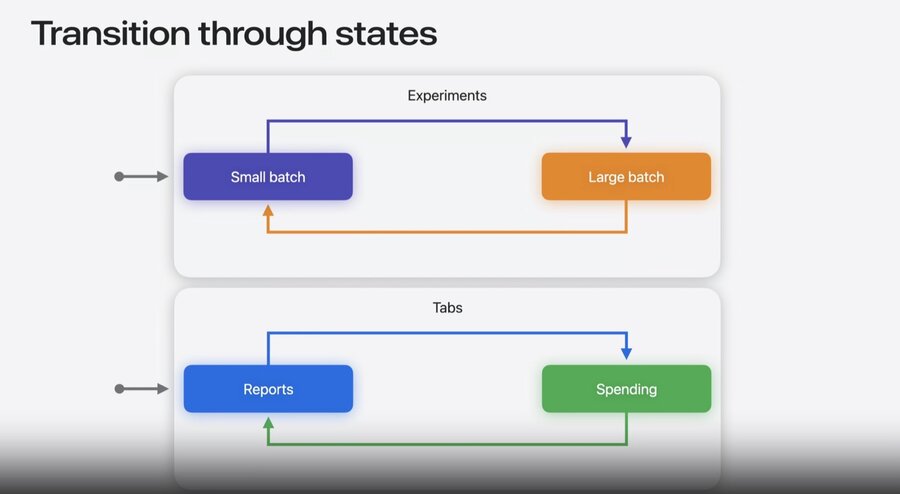
// Receive MetricKit data with states
import MetricKit
import StateReporting

let domain = StateReportingDomain("com.metrickitsample.tabs")
let manager = MetricManager(enabledStateReportingDomains: [domain])

// Report transitions throughout the app
let reporter = StateReporter.reporter(for: domain.rawValue)
reporter.reportTransition(to: "Reports")
Attach extra structured info to a state with a
@ReportableMetadatastruct
// Define custom structured types
import StateReporting

@ReportableMetadata
struct ViewConfiguration {
    let listSize: String
    let isSorted: Bool
}

let reporter = StateReporter.reporter(
    for: domain.rawValue,
    stableMetadata: ViewConfiguration.self
)

reporter.reportTransition(
    to: "Reports",
    stableMetadata: ViewConfiguration(listSize: "large", isSorted: false)
)
Access state-aware metrics
No states reported:
stateEntriesis empty (app-wide metrics only)With states: report gains
StateEntryvalues, each aggregating metrics for the time spent in that stateEncode grouped by domain via
MetricReport.EncodingFormat.byStateReportingDomain
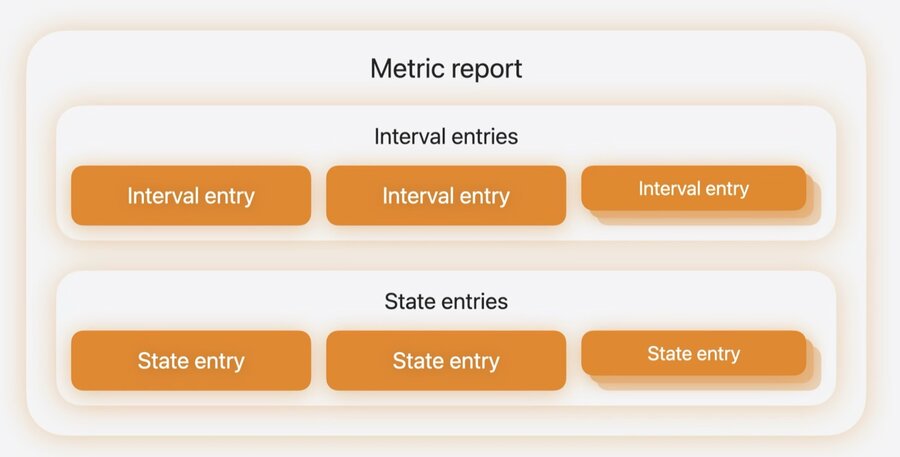
// Send encoded metric reports to the server
import MetricKit

for await report in manager.metricReports {
    let encoder = JSONEncoder()

    let formatKey = MetricReport.encodingFormatKey
    encoder.userInfo[formatKey] = MetricReport.EncodingFormat.byStateReportingDomain

    let jsonData = try encoder.encode(report)
    sendToServer(jsonData)
}Keep domains narrow, use stable meaningful states (not transient UI events), avoid too many states, and validate with the Points of Interest instrument before shipping.
