Pie Charts
Pie charts do not have axes, they’re: casual, intuitive, approachable
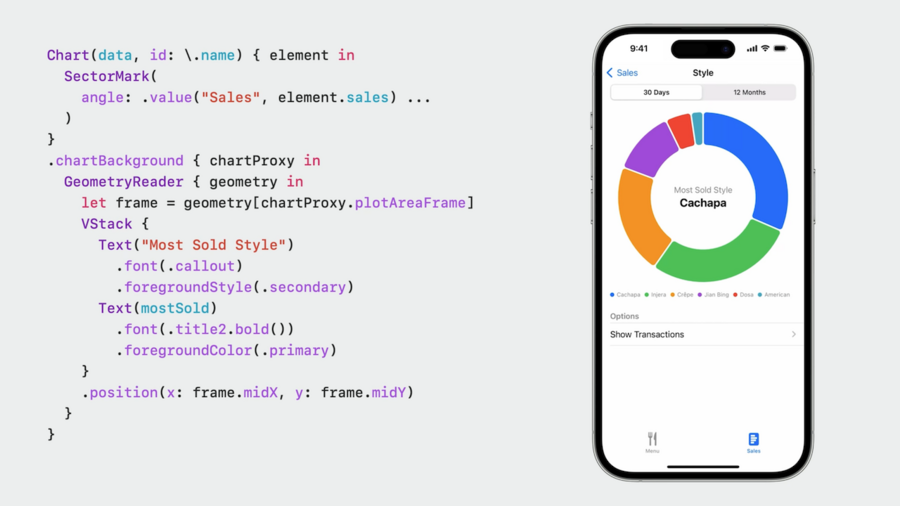
New mark-based composition syntax type
SectorSectoris a Position in Polar Coordinate System, size proportional to the valueBy increasing the inner radius, pie chart becomes a donut chart
To migrate from a bar chart to a pie chart, change
BarMarktoSectorMark, and argumentx:to argumentangle:Use
angularInset:param onSectorMarkto create space between pie pieces, supports also.cornerRadiusSet
innerRadius:param onSectorMarkto a.ratiovalue to turn into donut chart (e.g. golden ratio0.618)You can put text inside a donut chart by using
.chartBackgroundwhich usesGeometryReader
 .chartBackground modifier." loading="lazy" />
Selection
Use
chartXSelection(value: $selectedValueto store selected value to a@Binding var selectedValue: Value?Use
if let selectedValue {to define aRuleMarkwhen the value is non-nil to show selection in chartUse
.annotationmodifier on theRuleMarkto create a popover that shows additional details about the selectionUse
.overflowResolutionparam of.annotationand sety: .disabledto extend the annotation outside the chart view
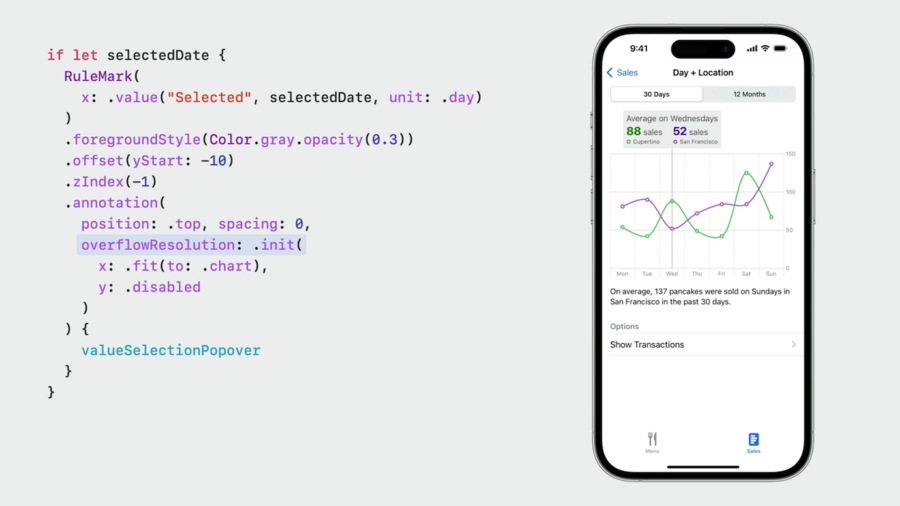 .annotation(...:overflowResolution:) modifier on
 RuleMark." loading="lazy" />
A variant of
.chartXSelectionwith argumentrangeallows to select a range of values (default: two finger tap on iOS, drag on macOS)Use
.chartGestureto define a custom gesture for value/range selection
Scrolling
Enable scrolling via
.chartScrollableAxes(.horizontal|.vertical)Define scrolling range using
.chartXVisibleDomain(length:)Store current scroll position in Binding using
chartScrollPosition(x: $scrollPosition)chartScrollTargetBehavior(.valueAligned(matching:majorAlignment:)allows “snapping” to specific values if neededMore on scrolling in session Beyond Scroll Views
