Time Profiler
uses infrastructure provided by the operating system to collect call stacks of relevant threads at a fixed interval.
Points of Interest
collects data from important areas of the app that we can highlight using various APIs such as Signpost API.
Time Profile Template
This template is used to profile both time and POI
lets us add even more instruments to get more insights on the app.
great tool for looking at issues that occur over a particular window of time. 
Track Viewer
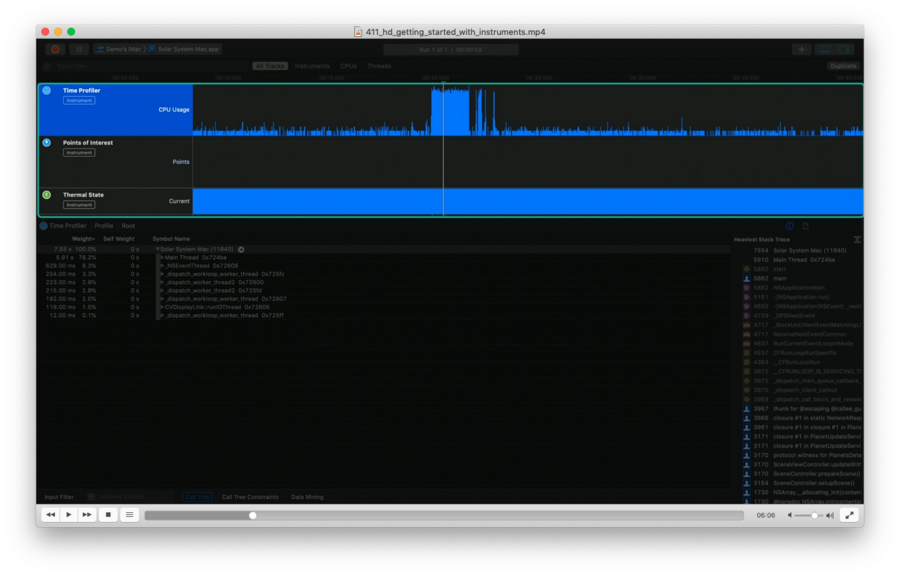 

A Track shows time series trace data corresponding to one source of events, such as the process, thread, or CPU core.
A single Instrument may contribute trace data to multiple Tracks.
The top Track is a summary of our application’s CPU utilization provided by the Time Profiler Instrument.
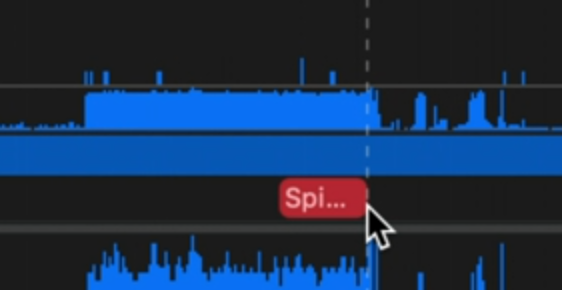
Spinning is how Instruments refers to your main thread being blocked:
Details View
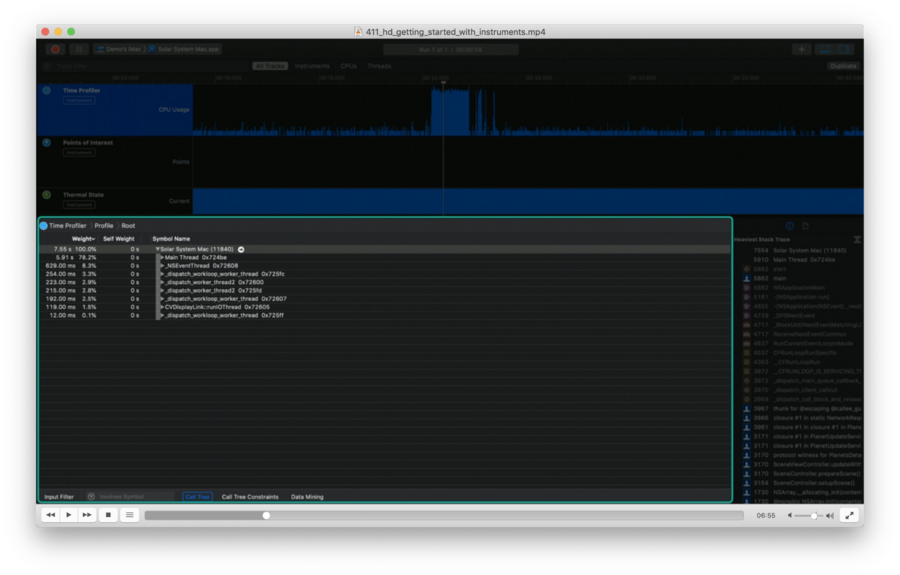
allows to explore the trace data for the selected Track.
when a time profiler trace is selected, it shows us a call graph: these are all the functions that were invoked during the time of the profile.
Detail inspector
When exploring the detail inspector (right column), we can click on a closure row to see it selected in the Detail view:
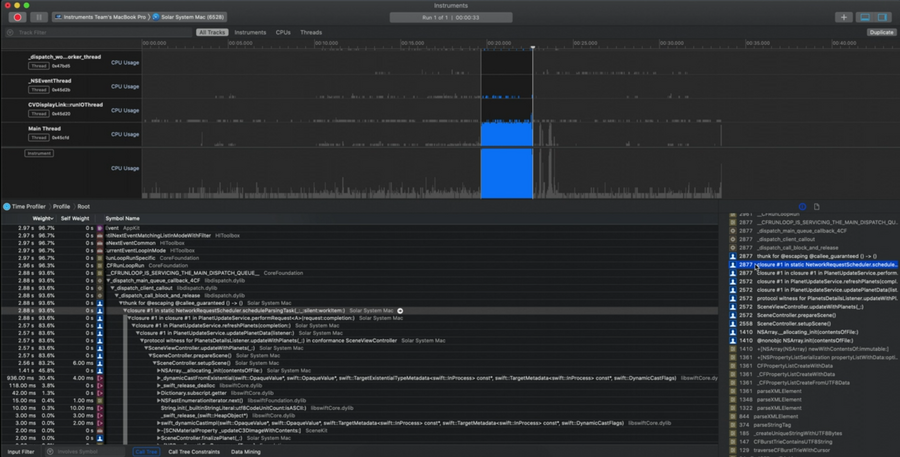
Double clicking the closure in the inspector jumps right into the line of code in the source.
Profiling tips
If you have response issues, check the main thread in the time profile.
profile in release mode
Using Signposts
More performant the print statements and the likes
Natively supported by Instruments
Has its own dedicated trace: Point of interestsThe POI trace shows a region of interest that corresponds to a Signpost interval that I added to my code.
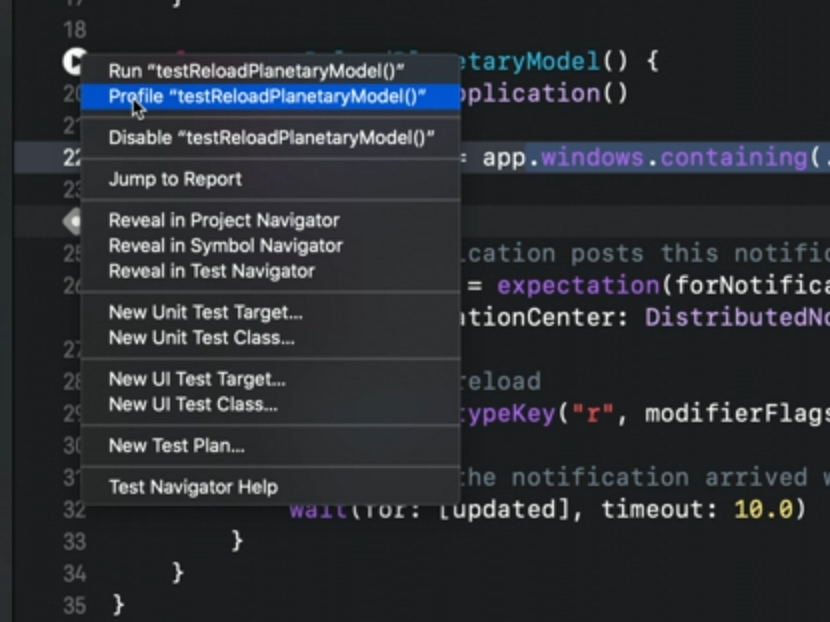
Profile Tests