View Debugger
Focus on troublesome views
Visualize your constraints
View Debugger helps you visualize the hierarchy of views in current view. It’s a great way to view the relationship between views(sibling and parent/child), also it’s a great place to see the auto layout constraints between these views.
Advanced Breakpoint Actions
Catch exceptions at throw, print message
Print expressions without adding clutter
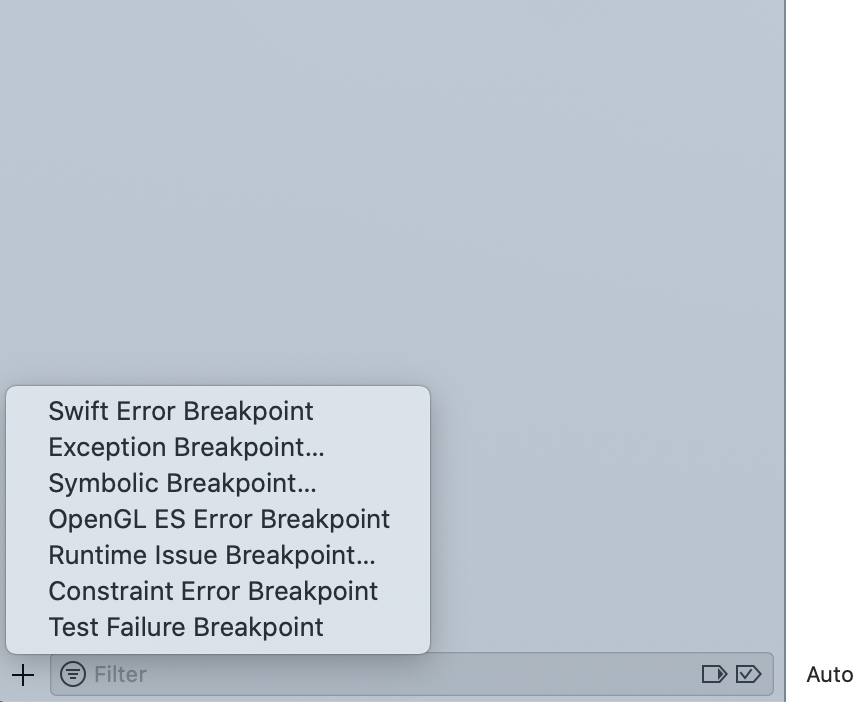
Under Breakpoint Navigator, user could manually add variety breakpoints, shows in the following image:
In the demo, click ‘Exception Breakpoint’ to add a general exception breakpoint, but this would not show any exception error information.
To display further information about exception error, one trick to do is in the console at the breakpoint, po $arg1 could print out the latest exception error message in the console, which means we could add this as an action for corresponding breakpoint.
Address Sanitizer (ASan)
Enable this tool in Edit Scheme... under Diagnostic
The benefit of using ASan to Analyze Memory Corruption
Use after free
Heap buffer overflow
Stack buffer overflow
Global variable overflow Overflows in C++ containers
Use after return
It’s better to use it under none [-O0] optimization configuration.
