Analyze hangs with Instruments
 Kyaw Zay Ya Lin Tun
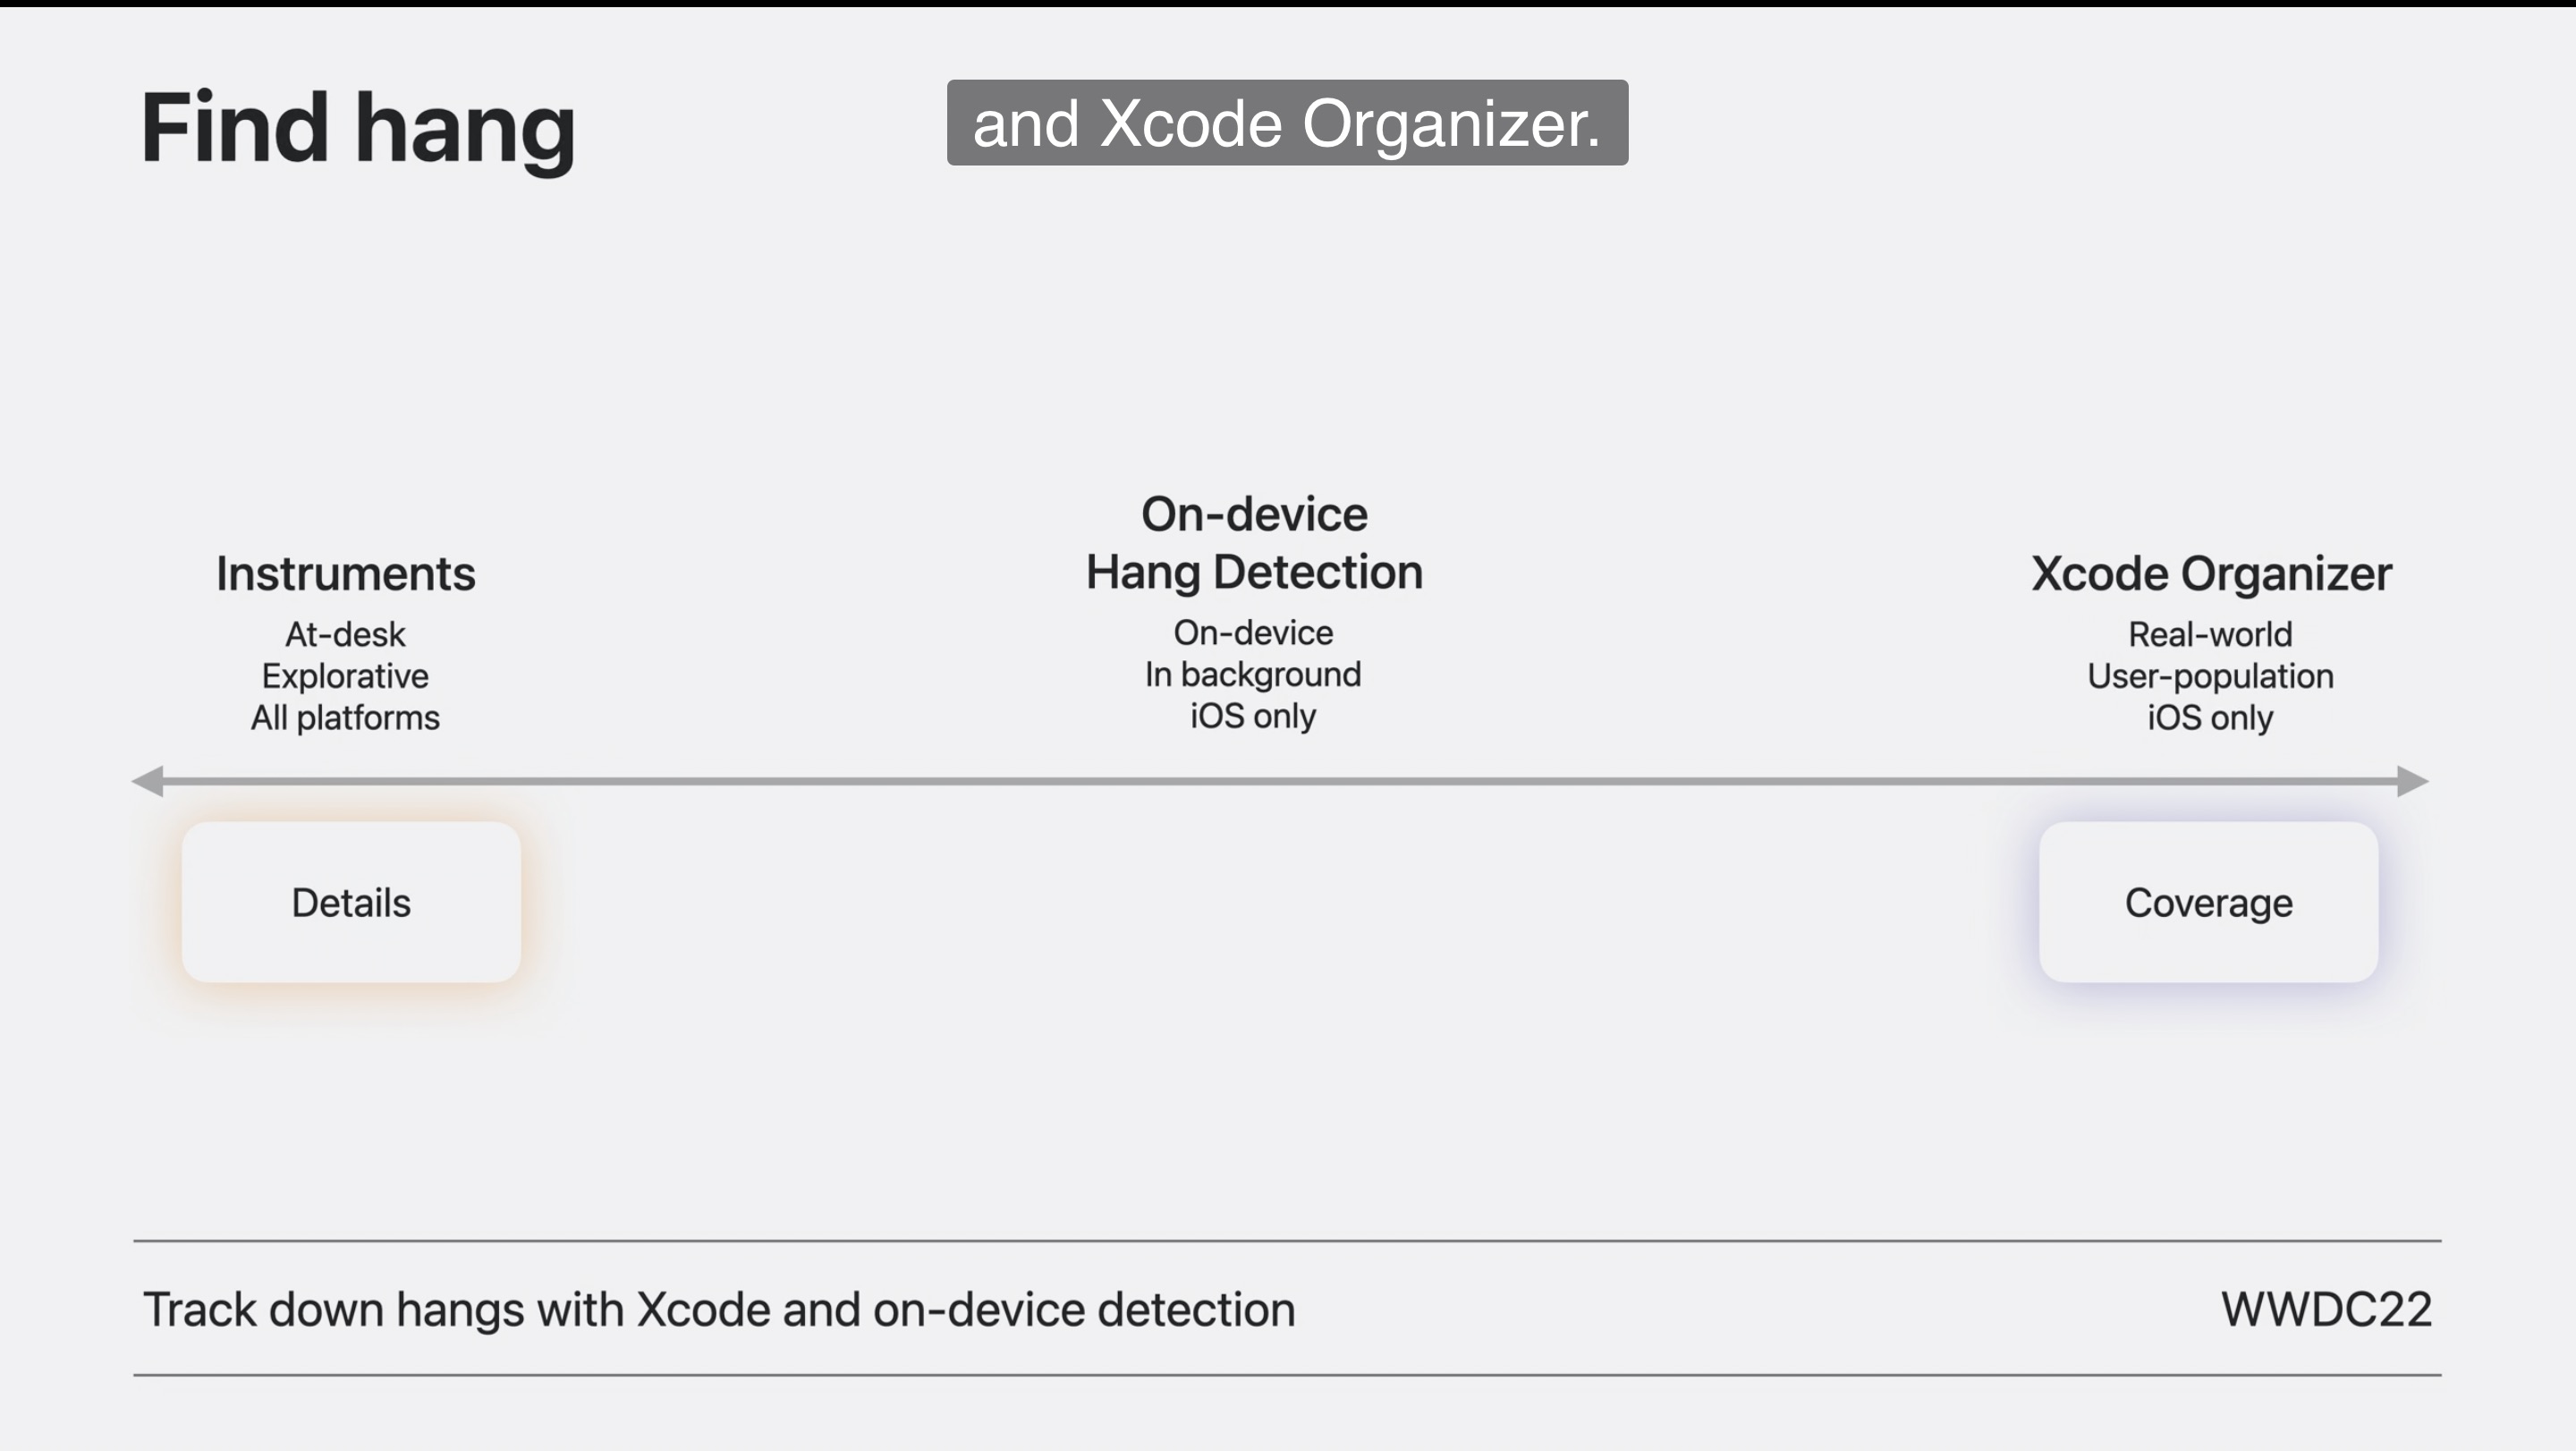
Description: User interface elements often mimic real-world interactions, including real-time responses. Apps with a noticeable delay in user interaction — a hang — can break that illusion and create frustration. We'll show you how to use Instruments to analyze, understand, and fix hangs in your apps on all Apple platforms. Discover how you can efficiently navigate an Instruments trace document, interpret trace data, and record additional profiling data to better understand your specific hang. If you aren't familiar with using Instruments, we recommend first watching "Getting Started with Instruments." And to learn about other tools that can help you discover hangs in your app, check out "Track down hangs with Xcode and on-device detection."
What is a hang?
When dealing with hangs, there’re three steps you need to follow; find a hang, analyze a hang to understand how it happens, and then, fix it. This talk will be focusing on the analyzing part and some fixes.
Hang == Delay. What kind of delay is acceptable depends on the circumstances.
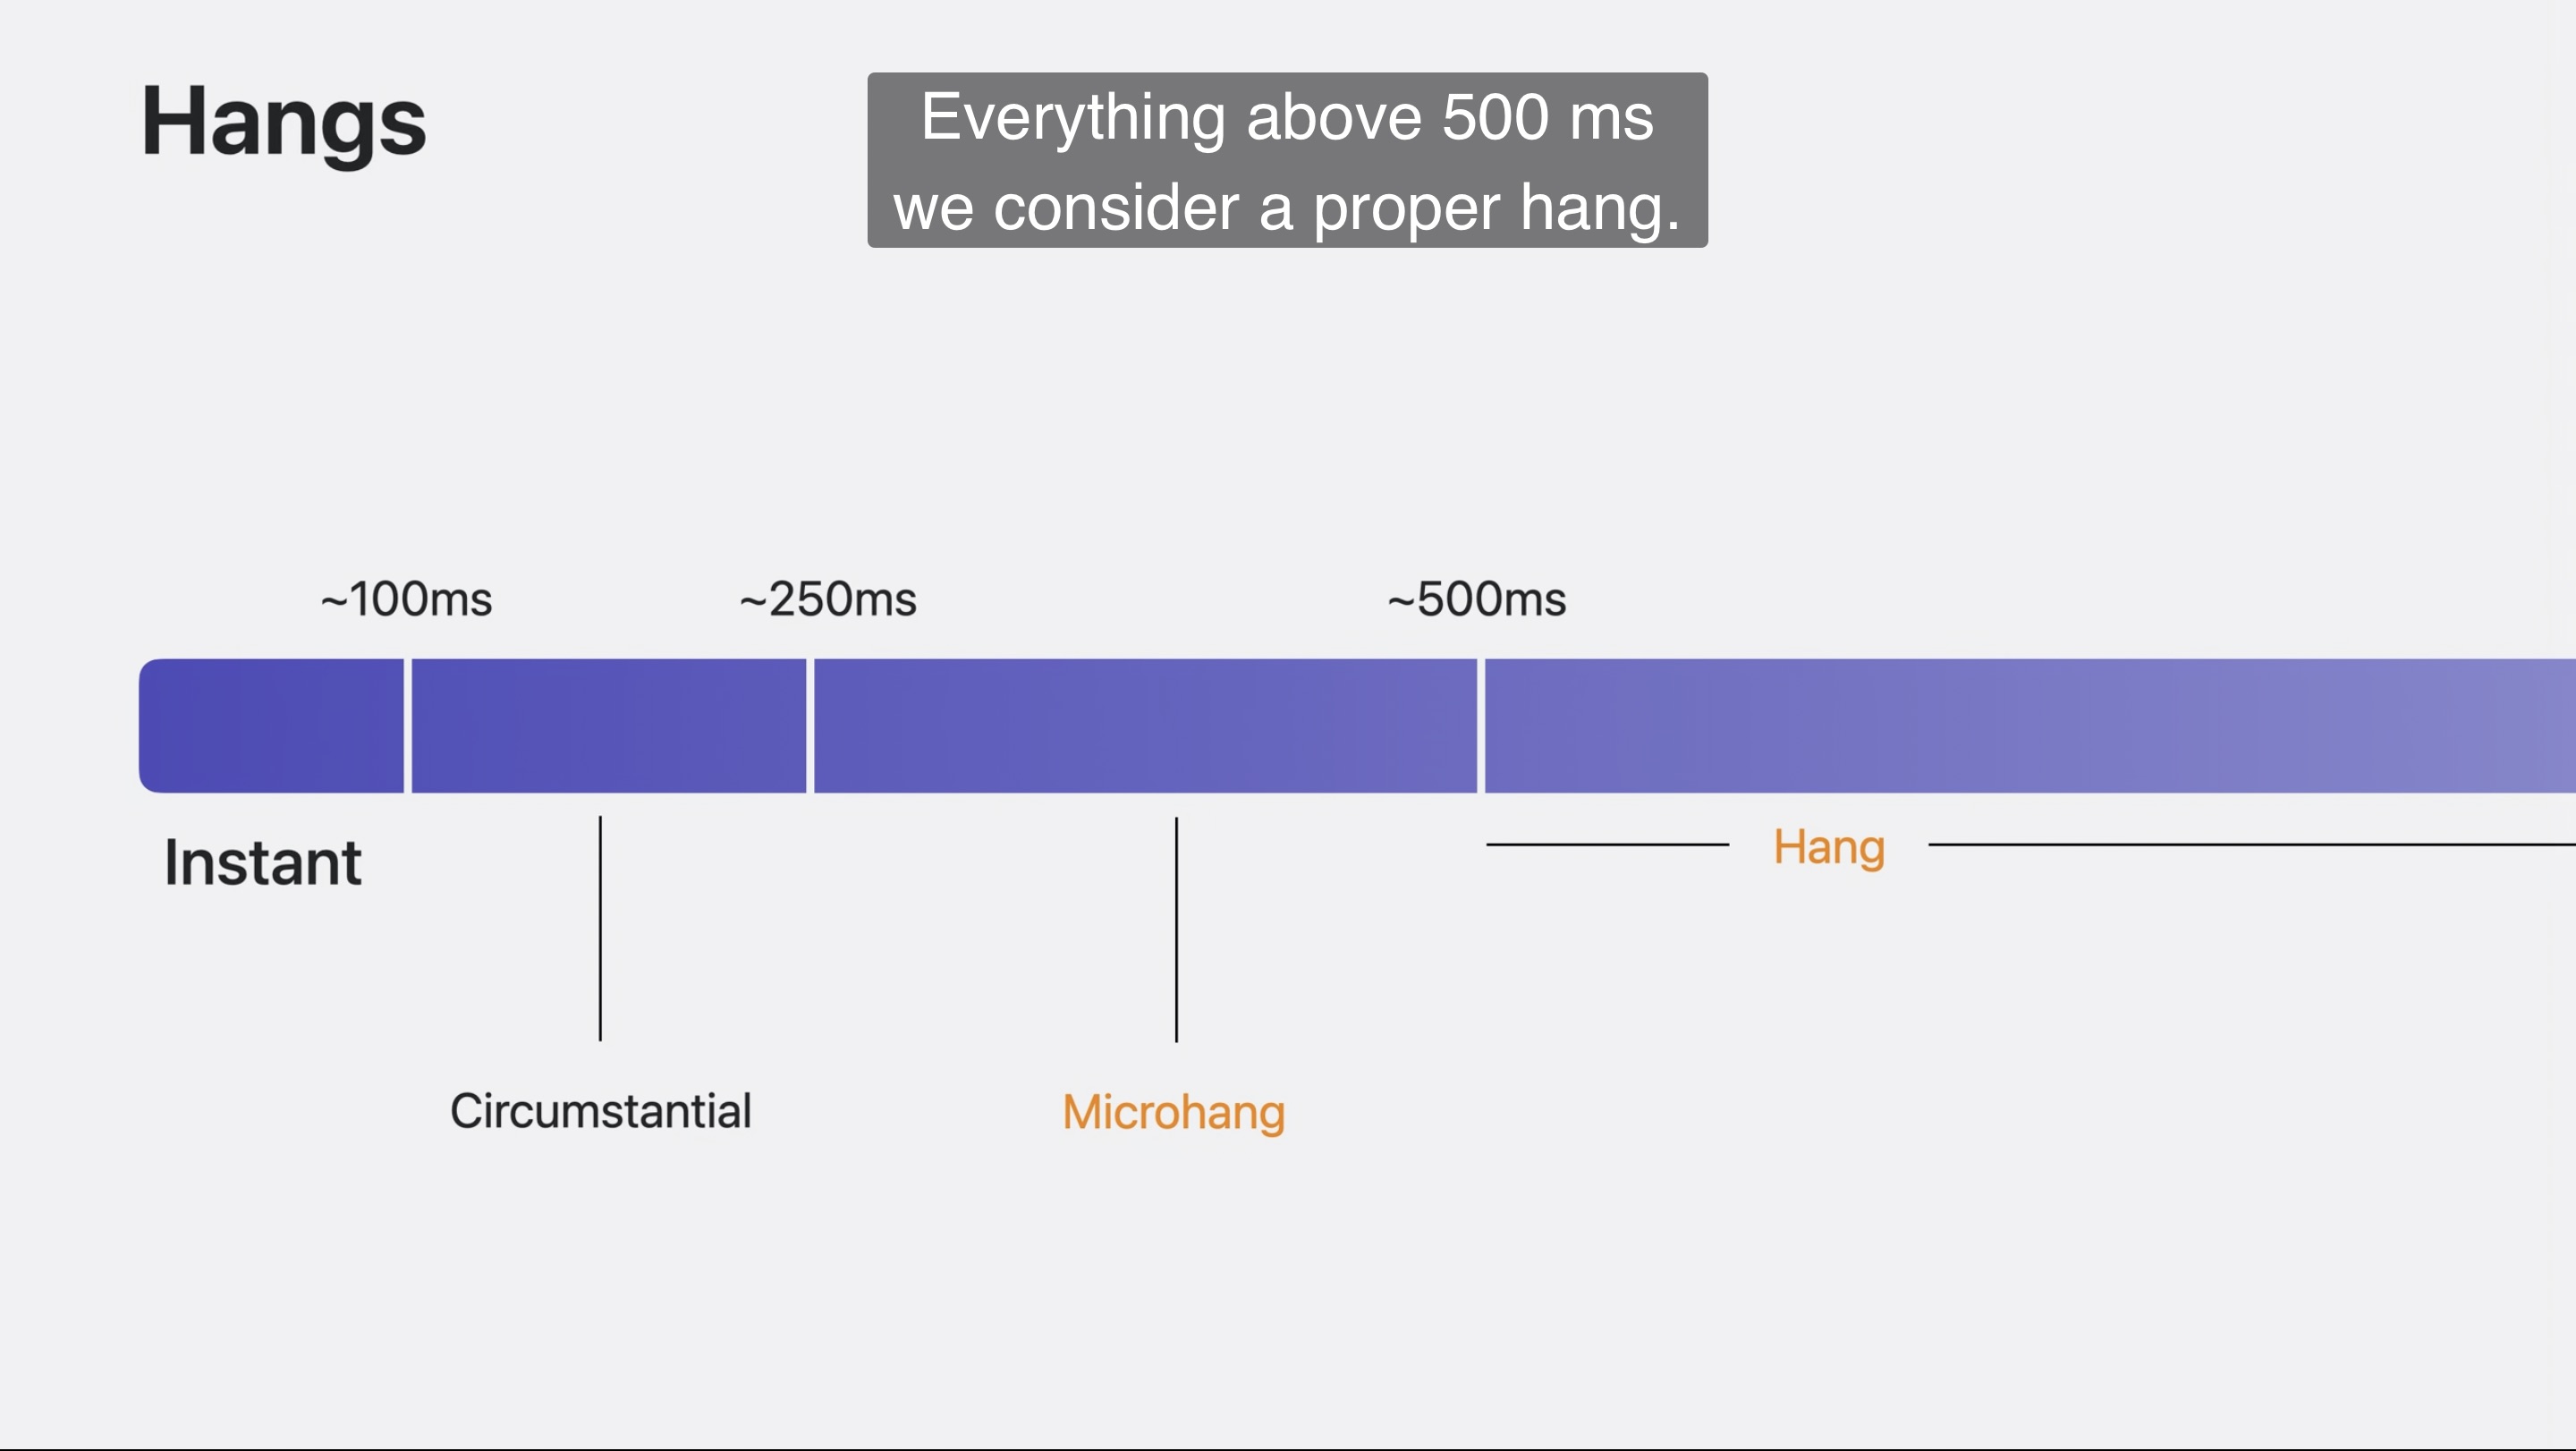
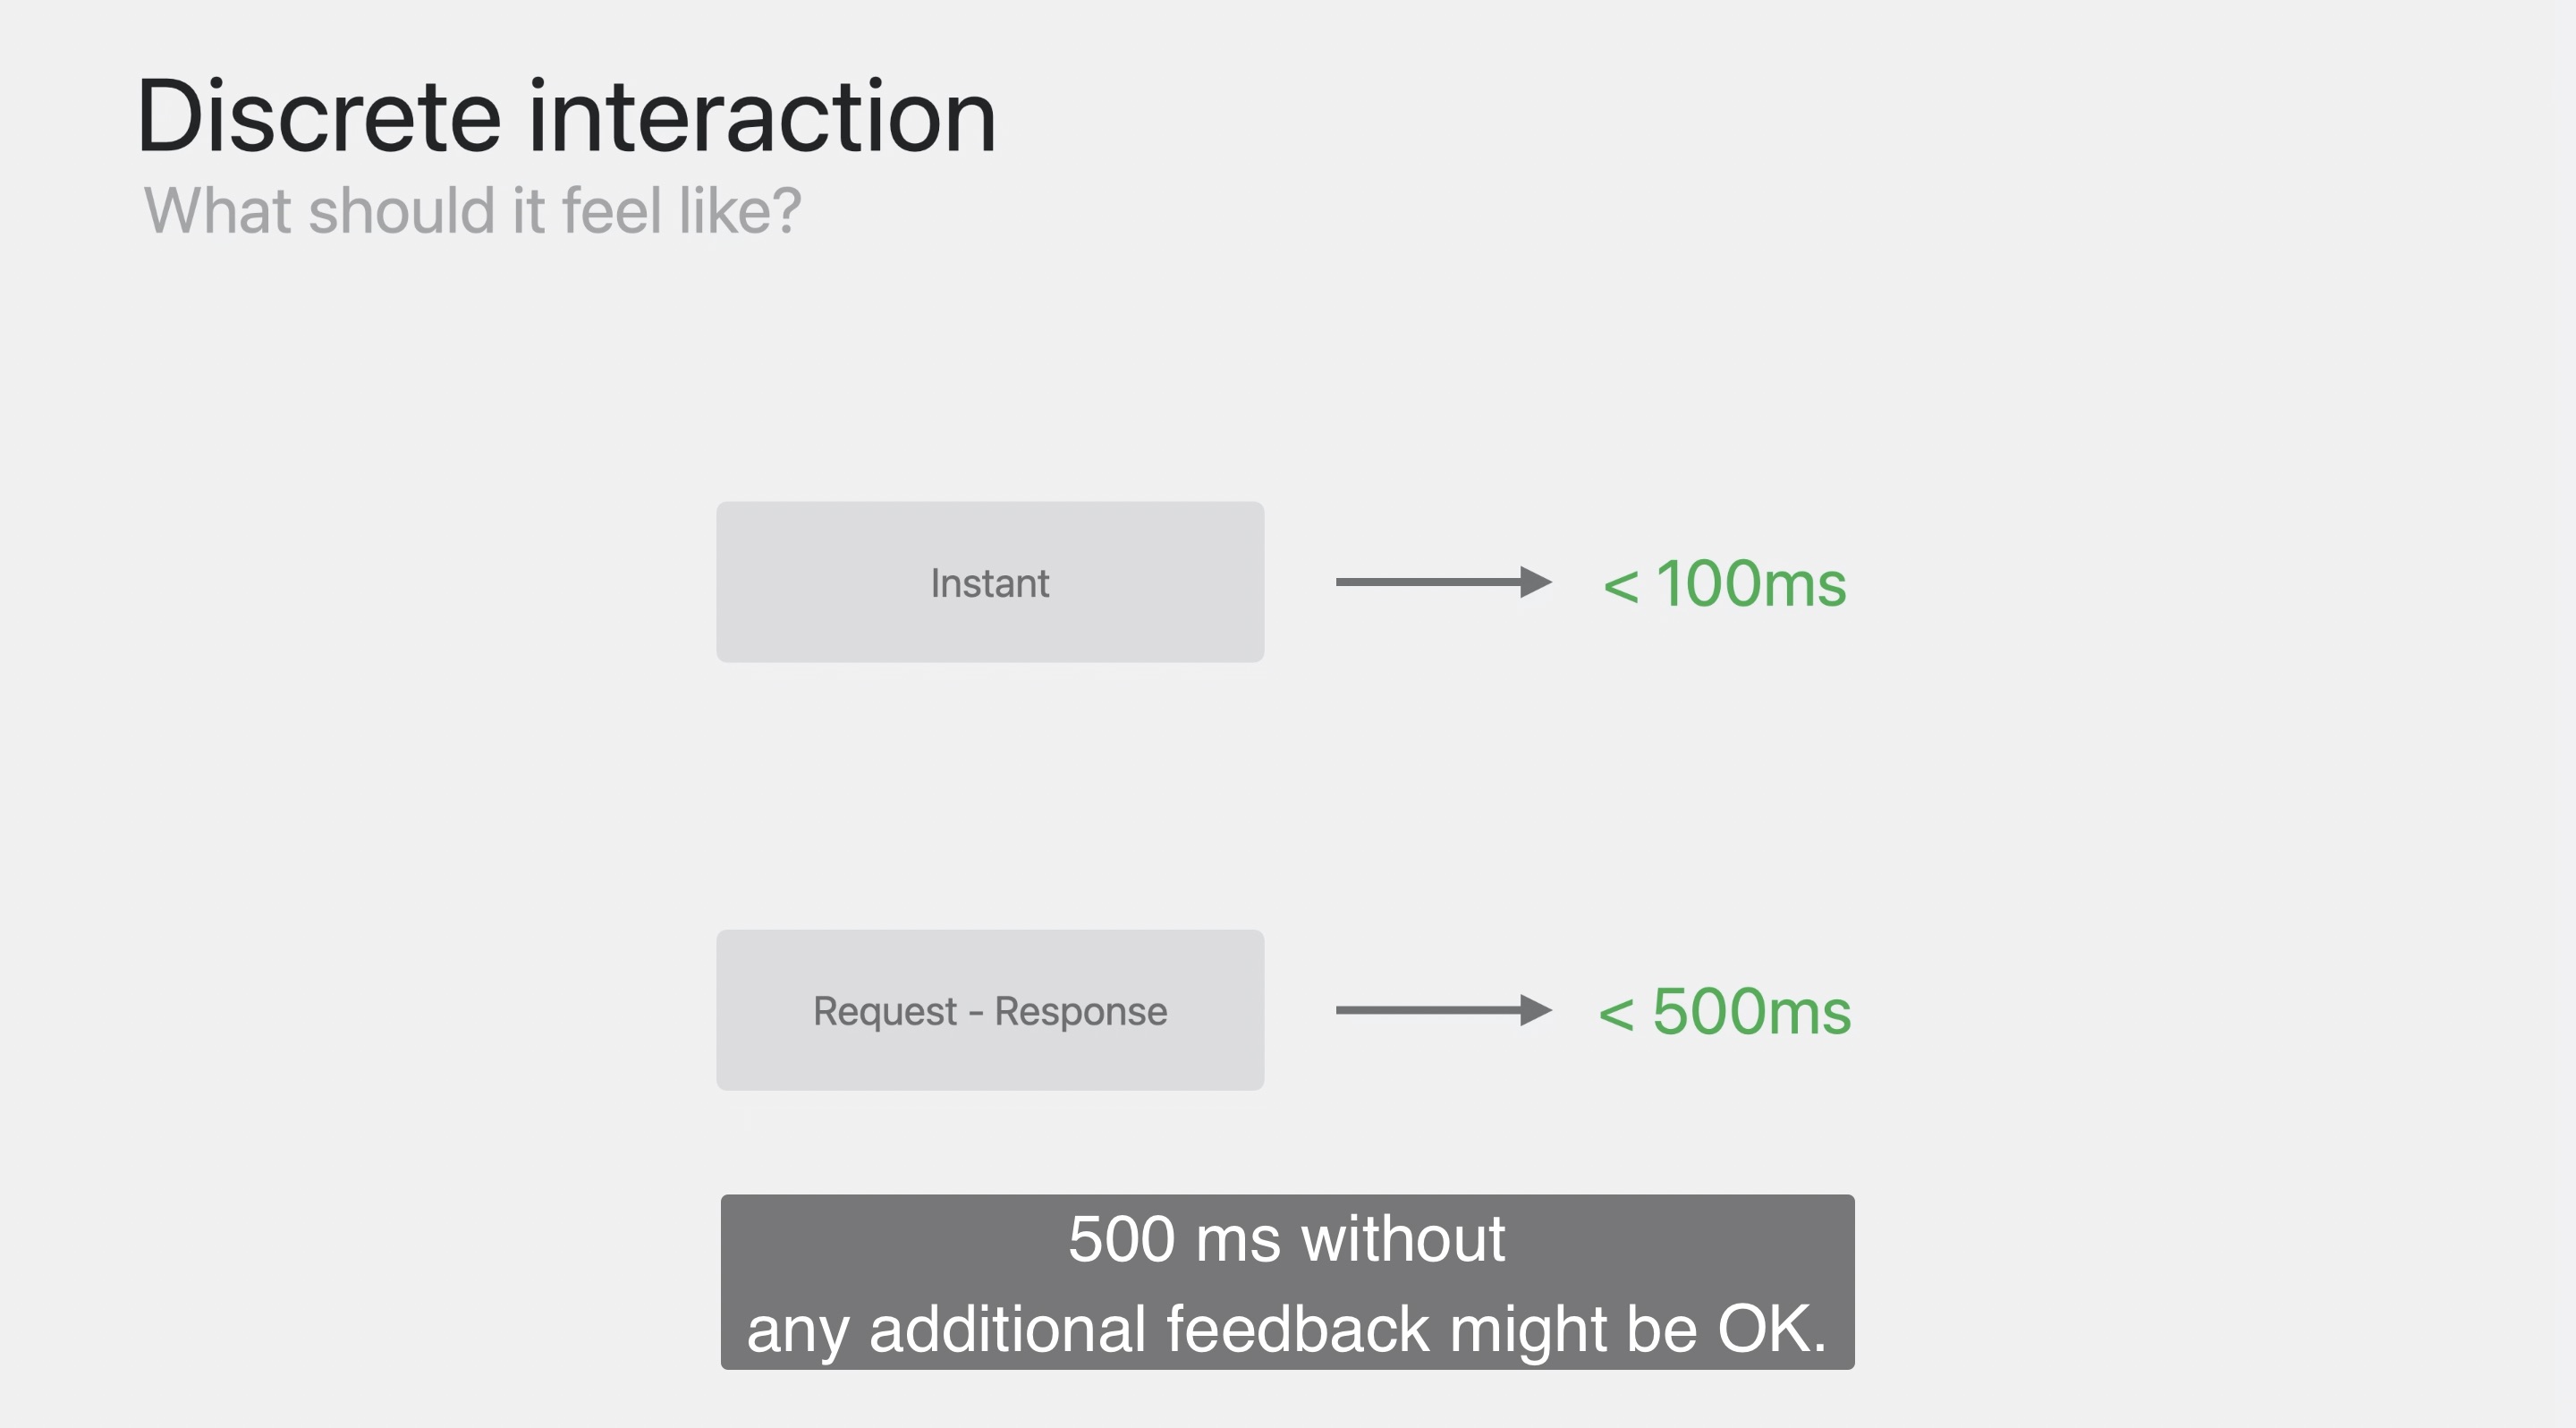
For a discrete interaction, a delay below
~ 100ms → You will usually feel instant
~ 250ms → It depends on the circumstances,
longer than 250ms → It becomes noticeable at least subconsciously
Delay above 250ms doesn’t feel instant anymore. That’s why most of instrument tools start reporting hangs by default starting at 250ms.
To enable our UI elements to react “instantly”, it is vital to keep the main thread free from non-UI work.
Event handling and rendering loop
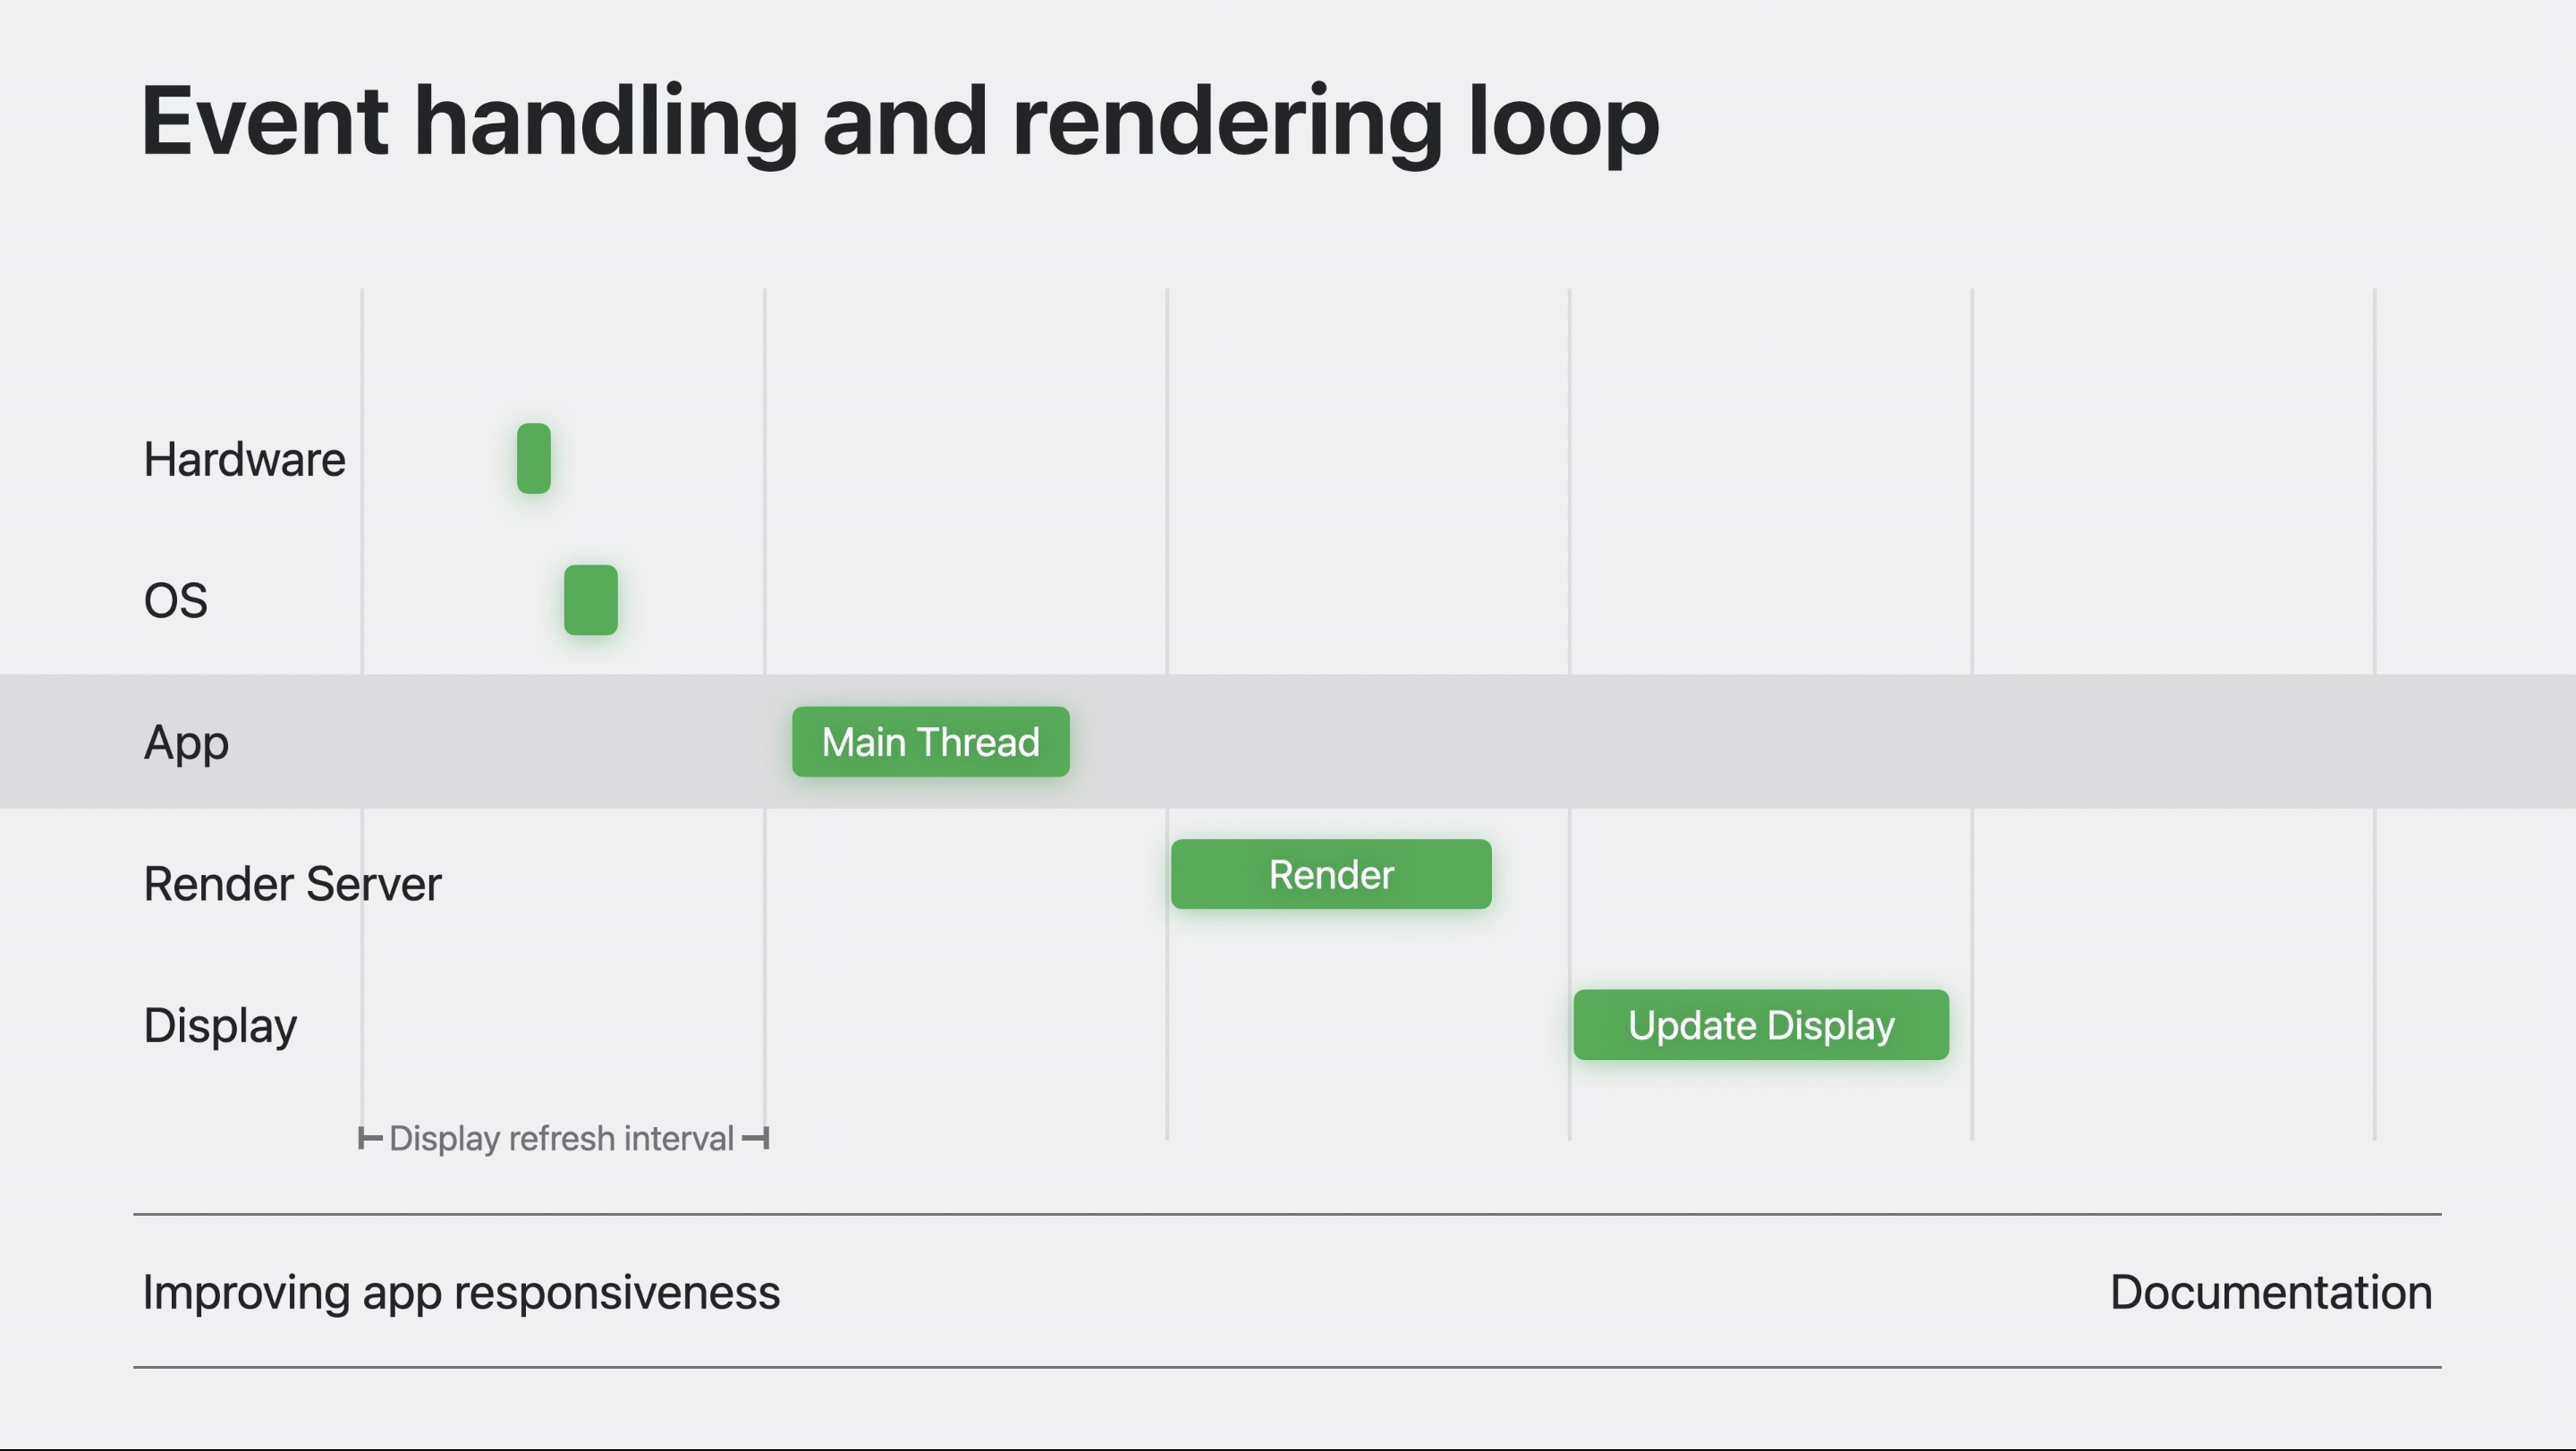
Given that every update to a UI element needs some time on the main thread, and we want these updates to happen within 100 ms to feel real. Ideally, no work on the main thread should take longer than 100 ms. If you can be faster, even better. Long-running work on the main thread can also cause hitches.
Profiling you app on Xcode
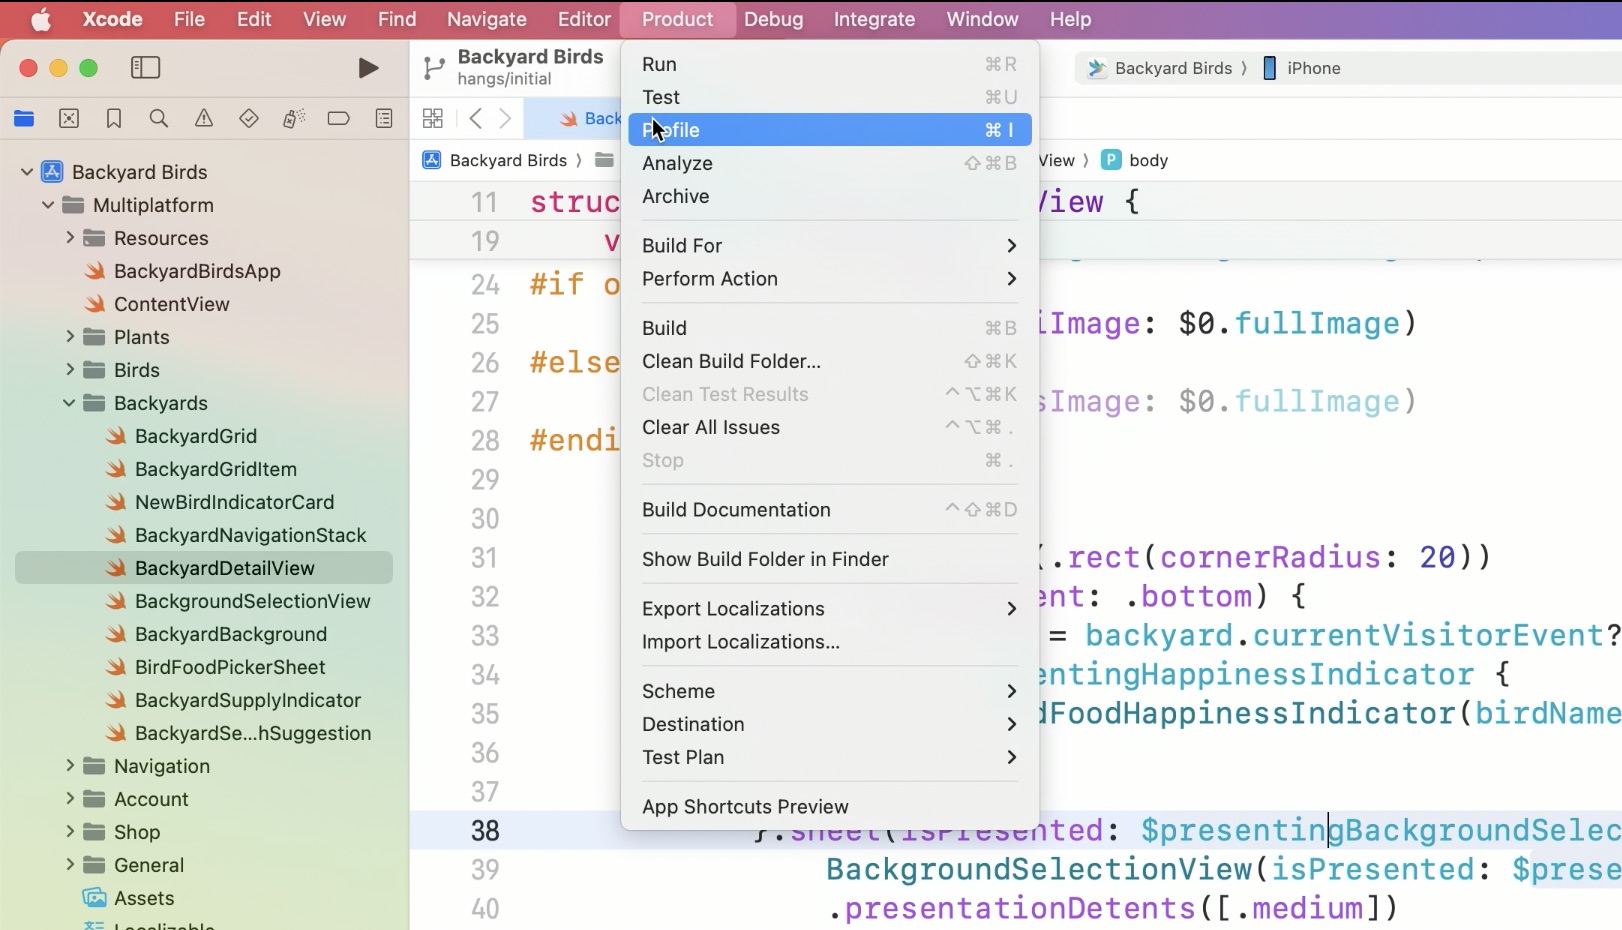
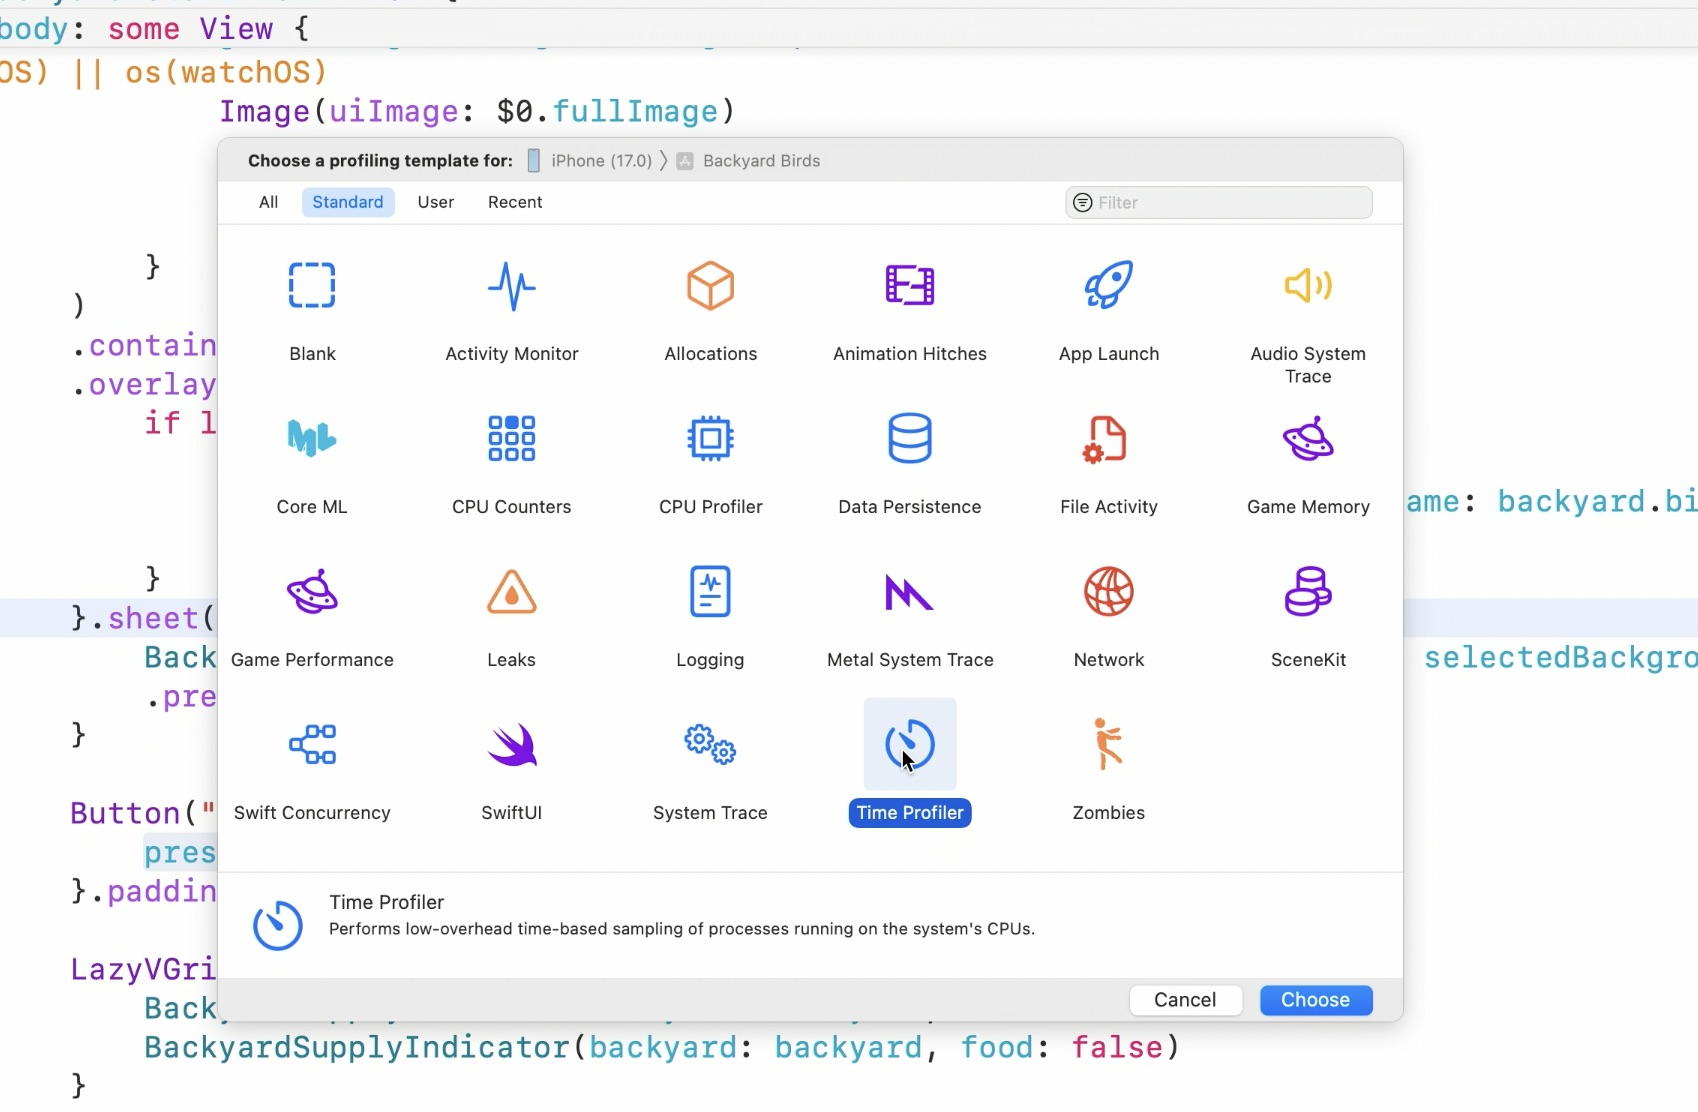
Shortly, Xcode will install your app on device, but, it will not launch it. Instead, you will see an instrument template chooser on your screen. Choose “Time Profiler”. Time profiler is a good starting point if you don’t yet know what you are looking for and want to get a better understanding of what your app is doing.
It will create a new time profiler document, which includes time profiler and hangs profiler, both of which will be useful for addressing hangs.
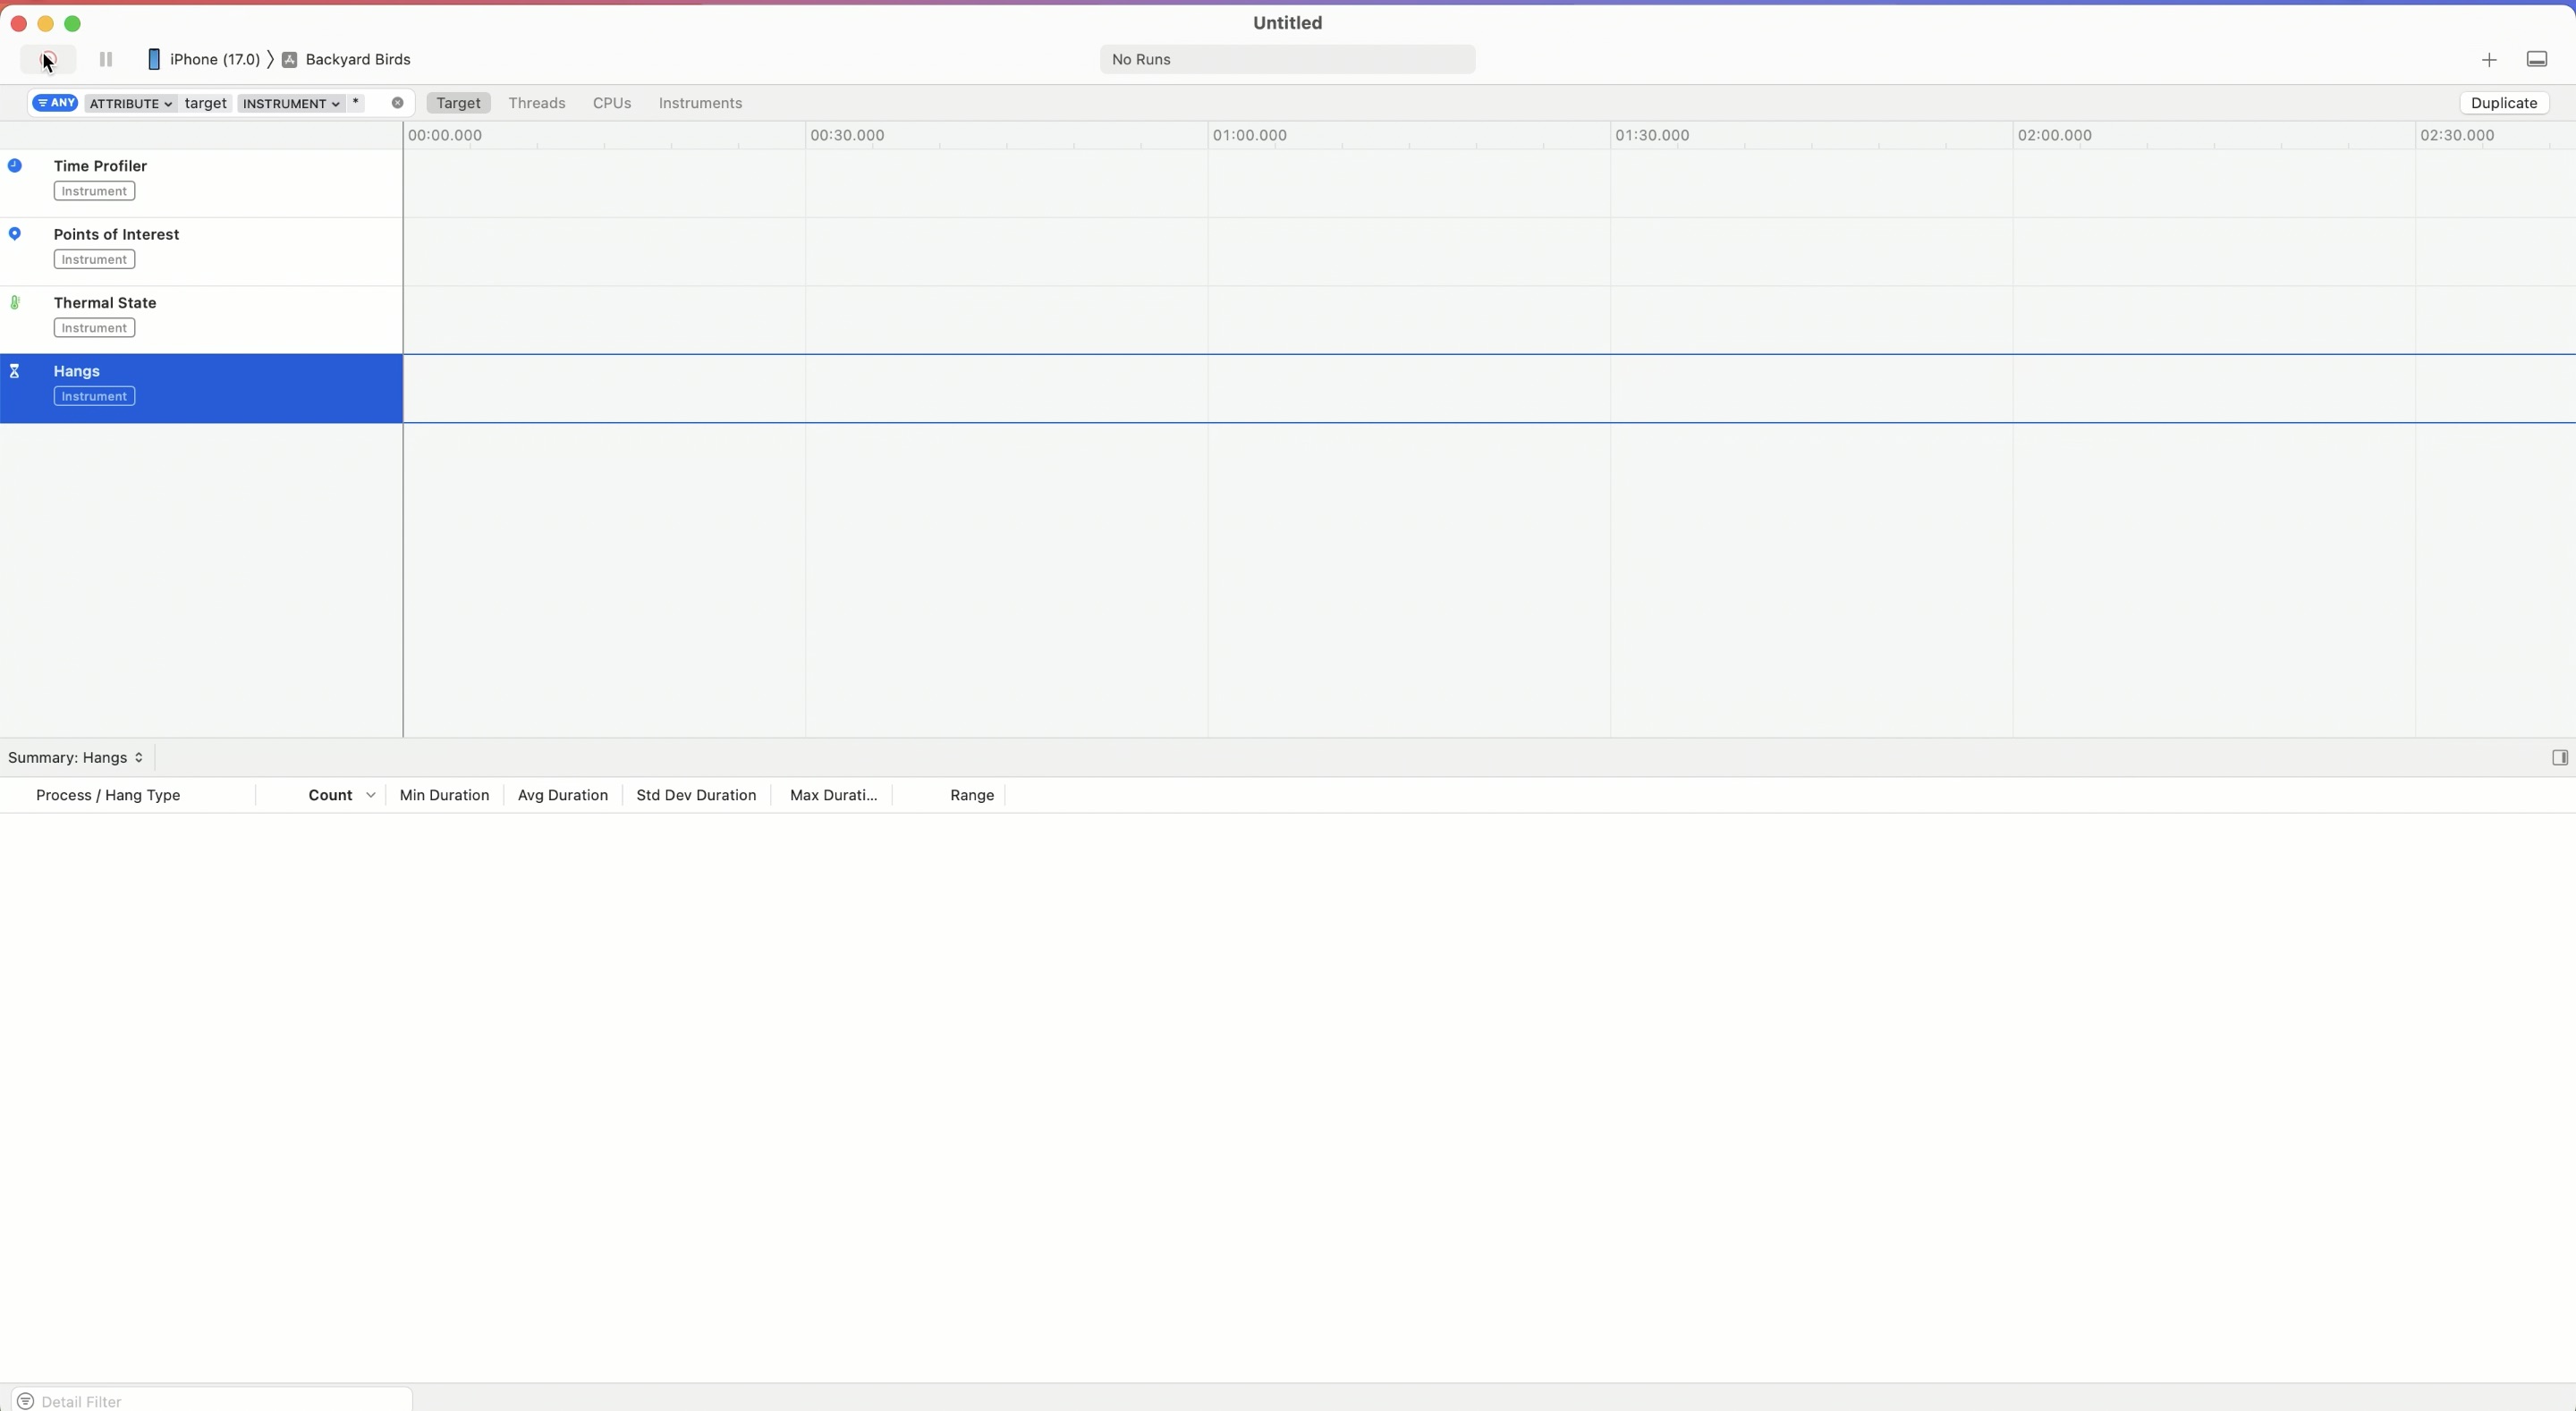
Hit record button at the top-left of the tool bar. It will launch the configured application and start capturing data. And use you app as you normally would. Instruments will record all of your app’s data. Once you found the hang, hit the stop recording button in the toolbar. In this talk, he used Backyard Birds app to demonstrate hangs.
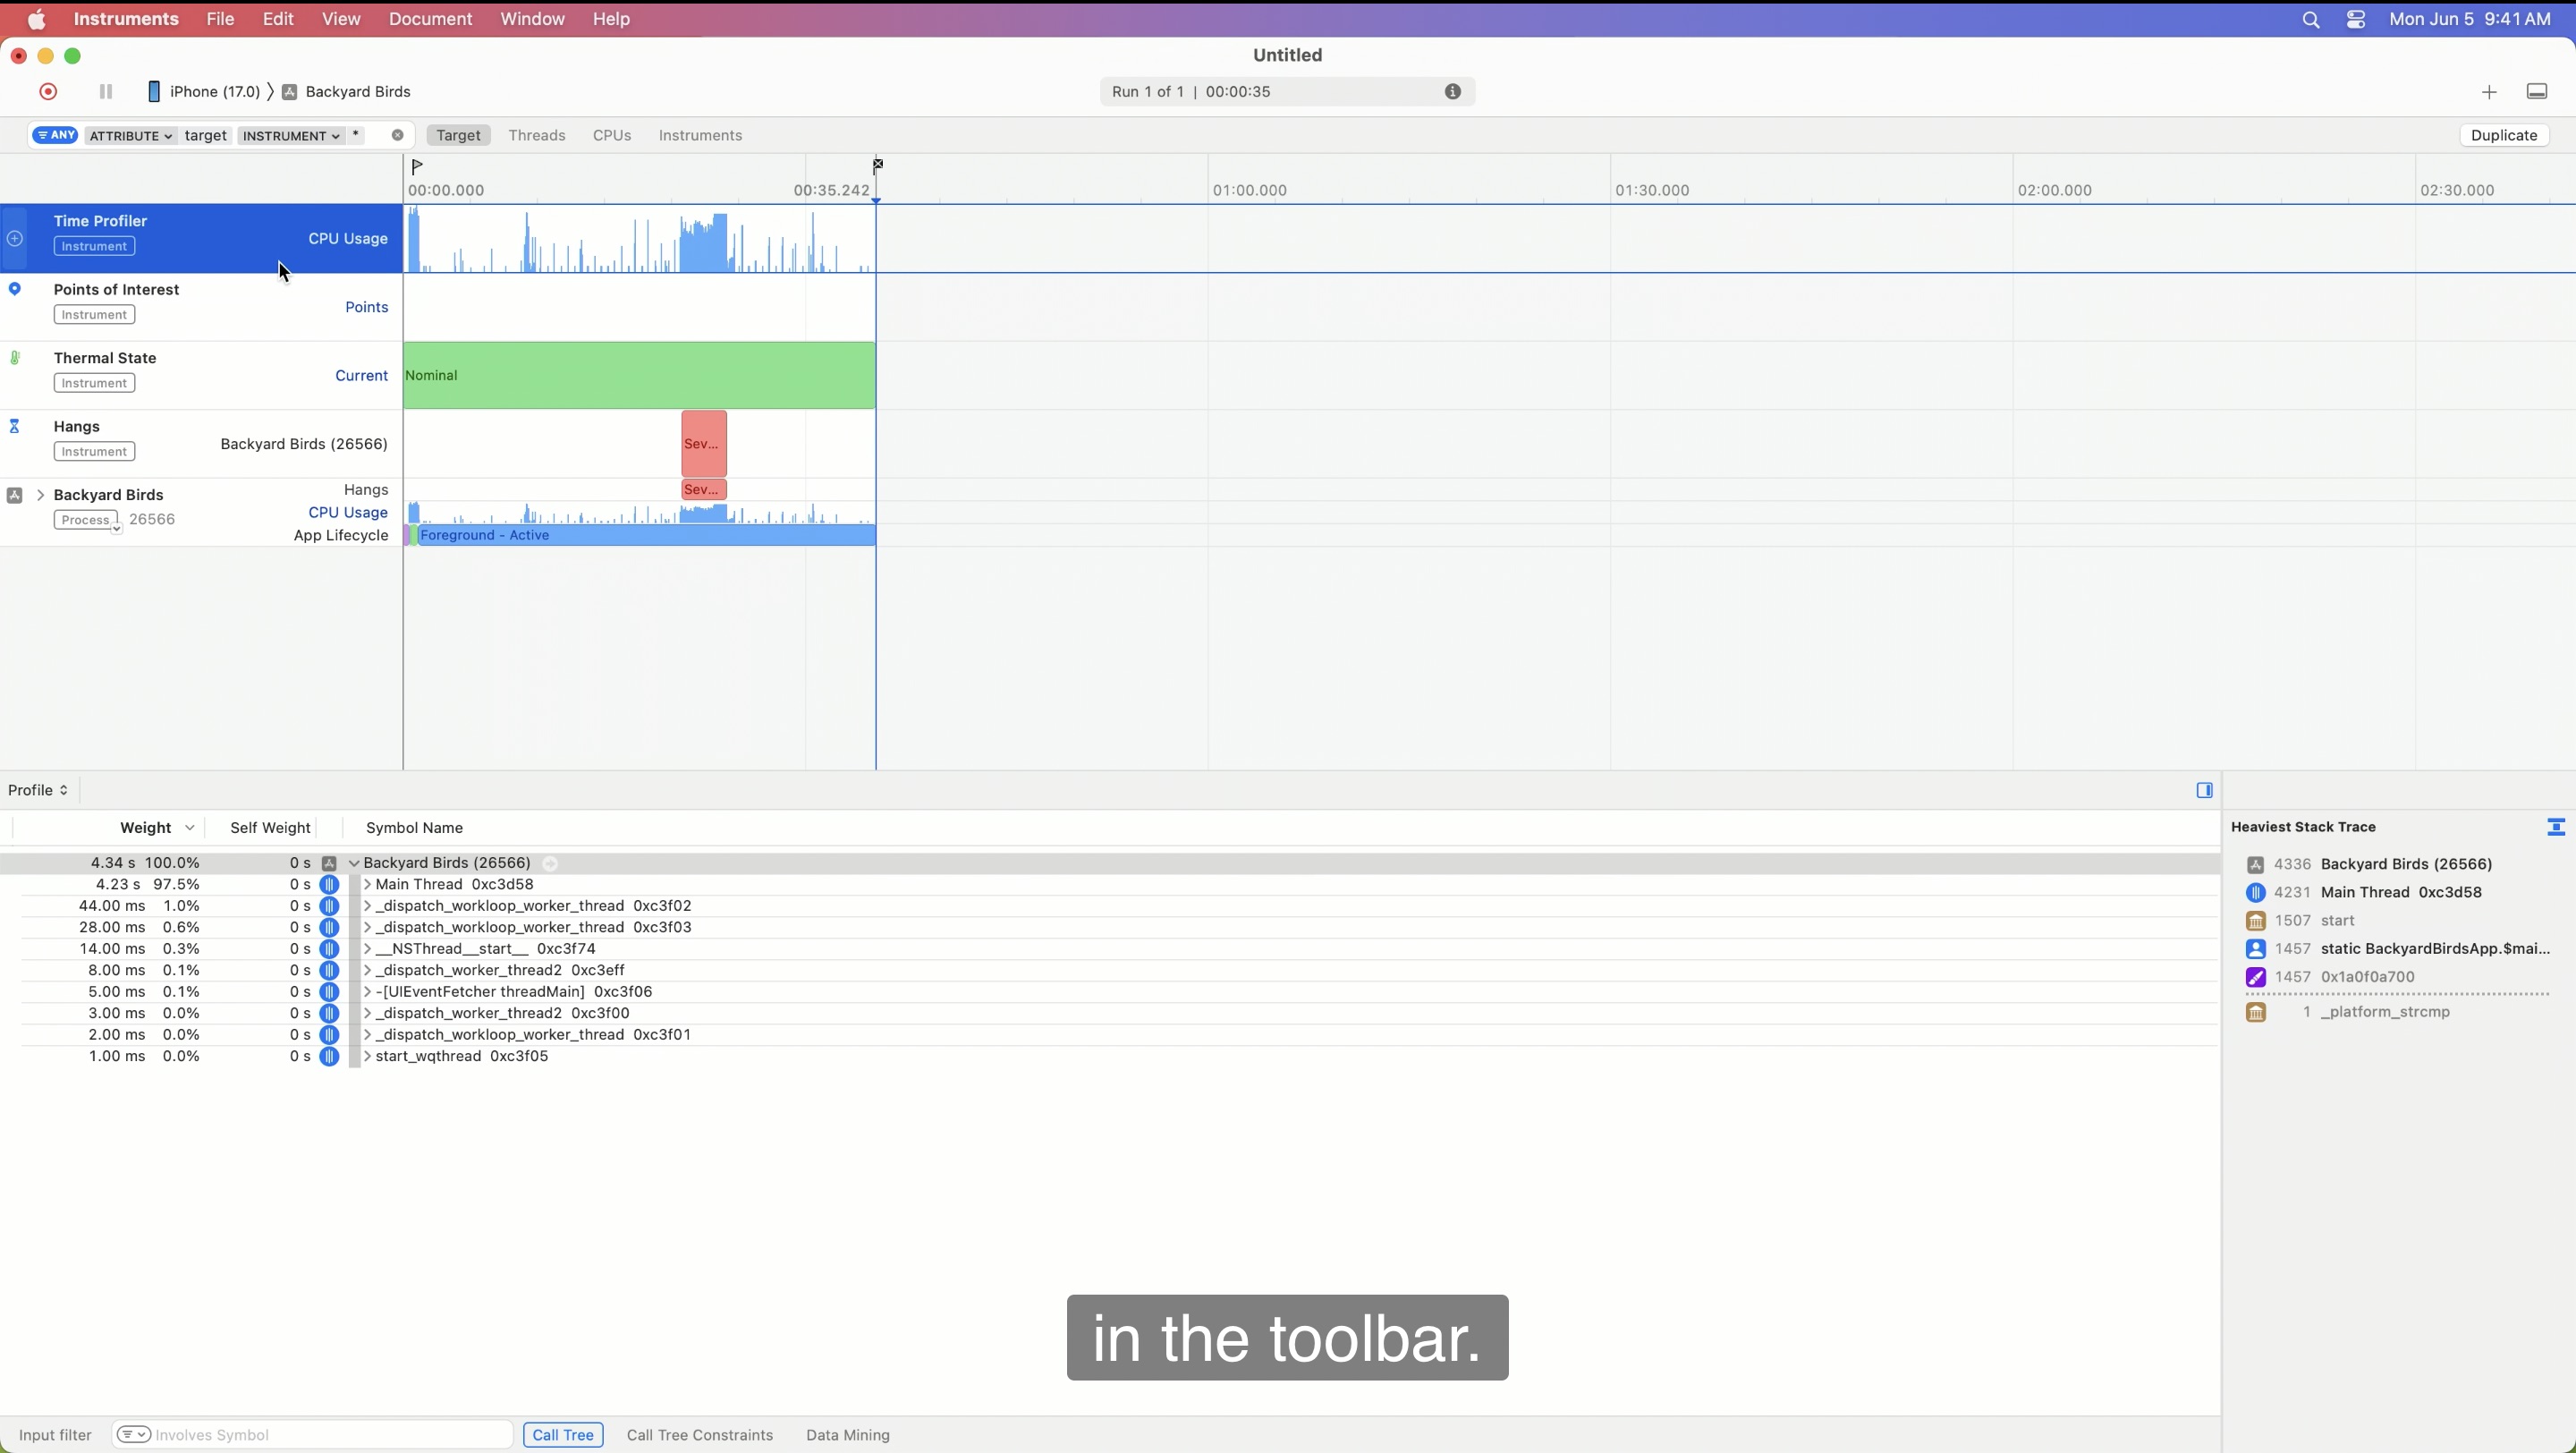
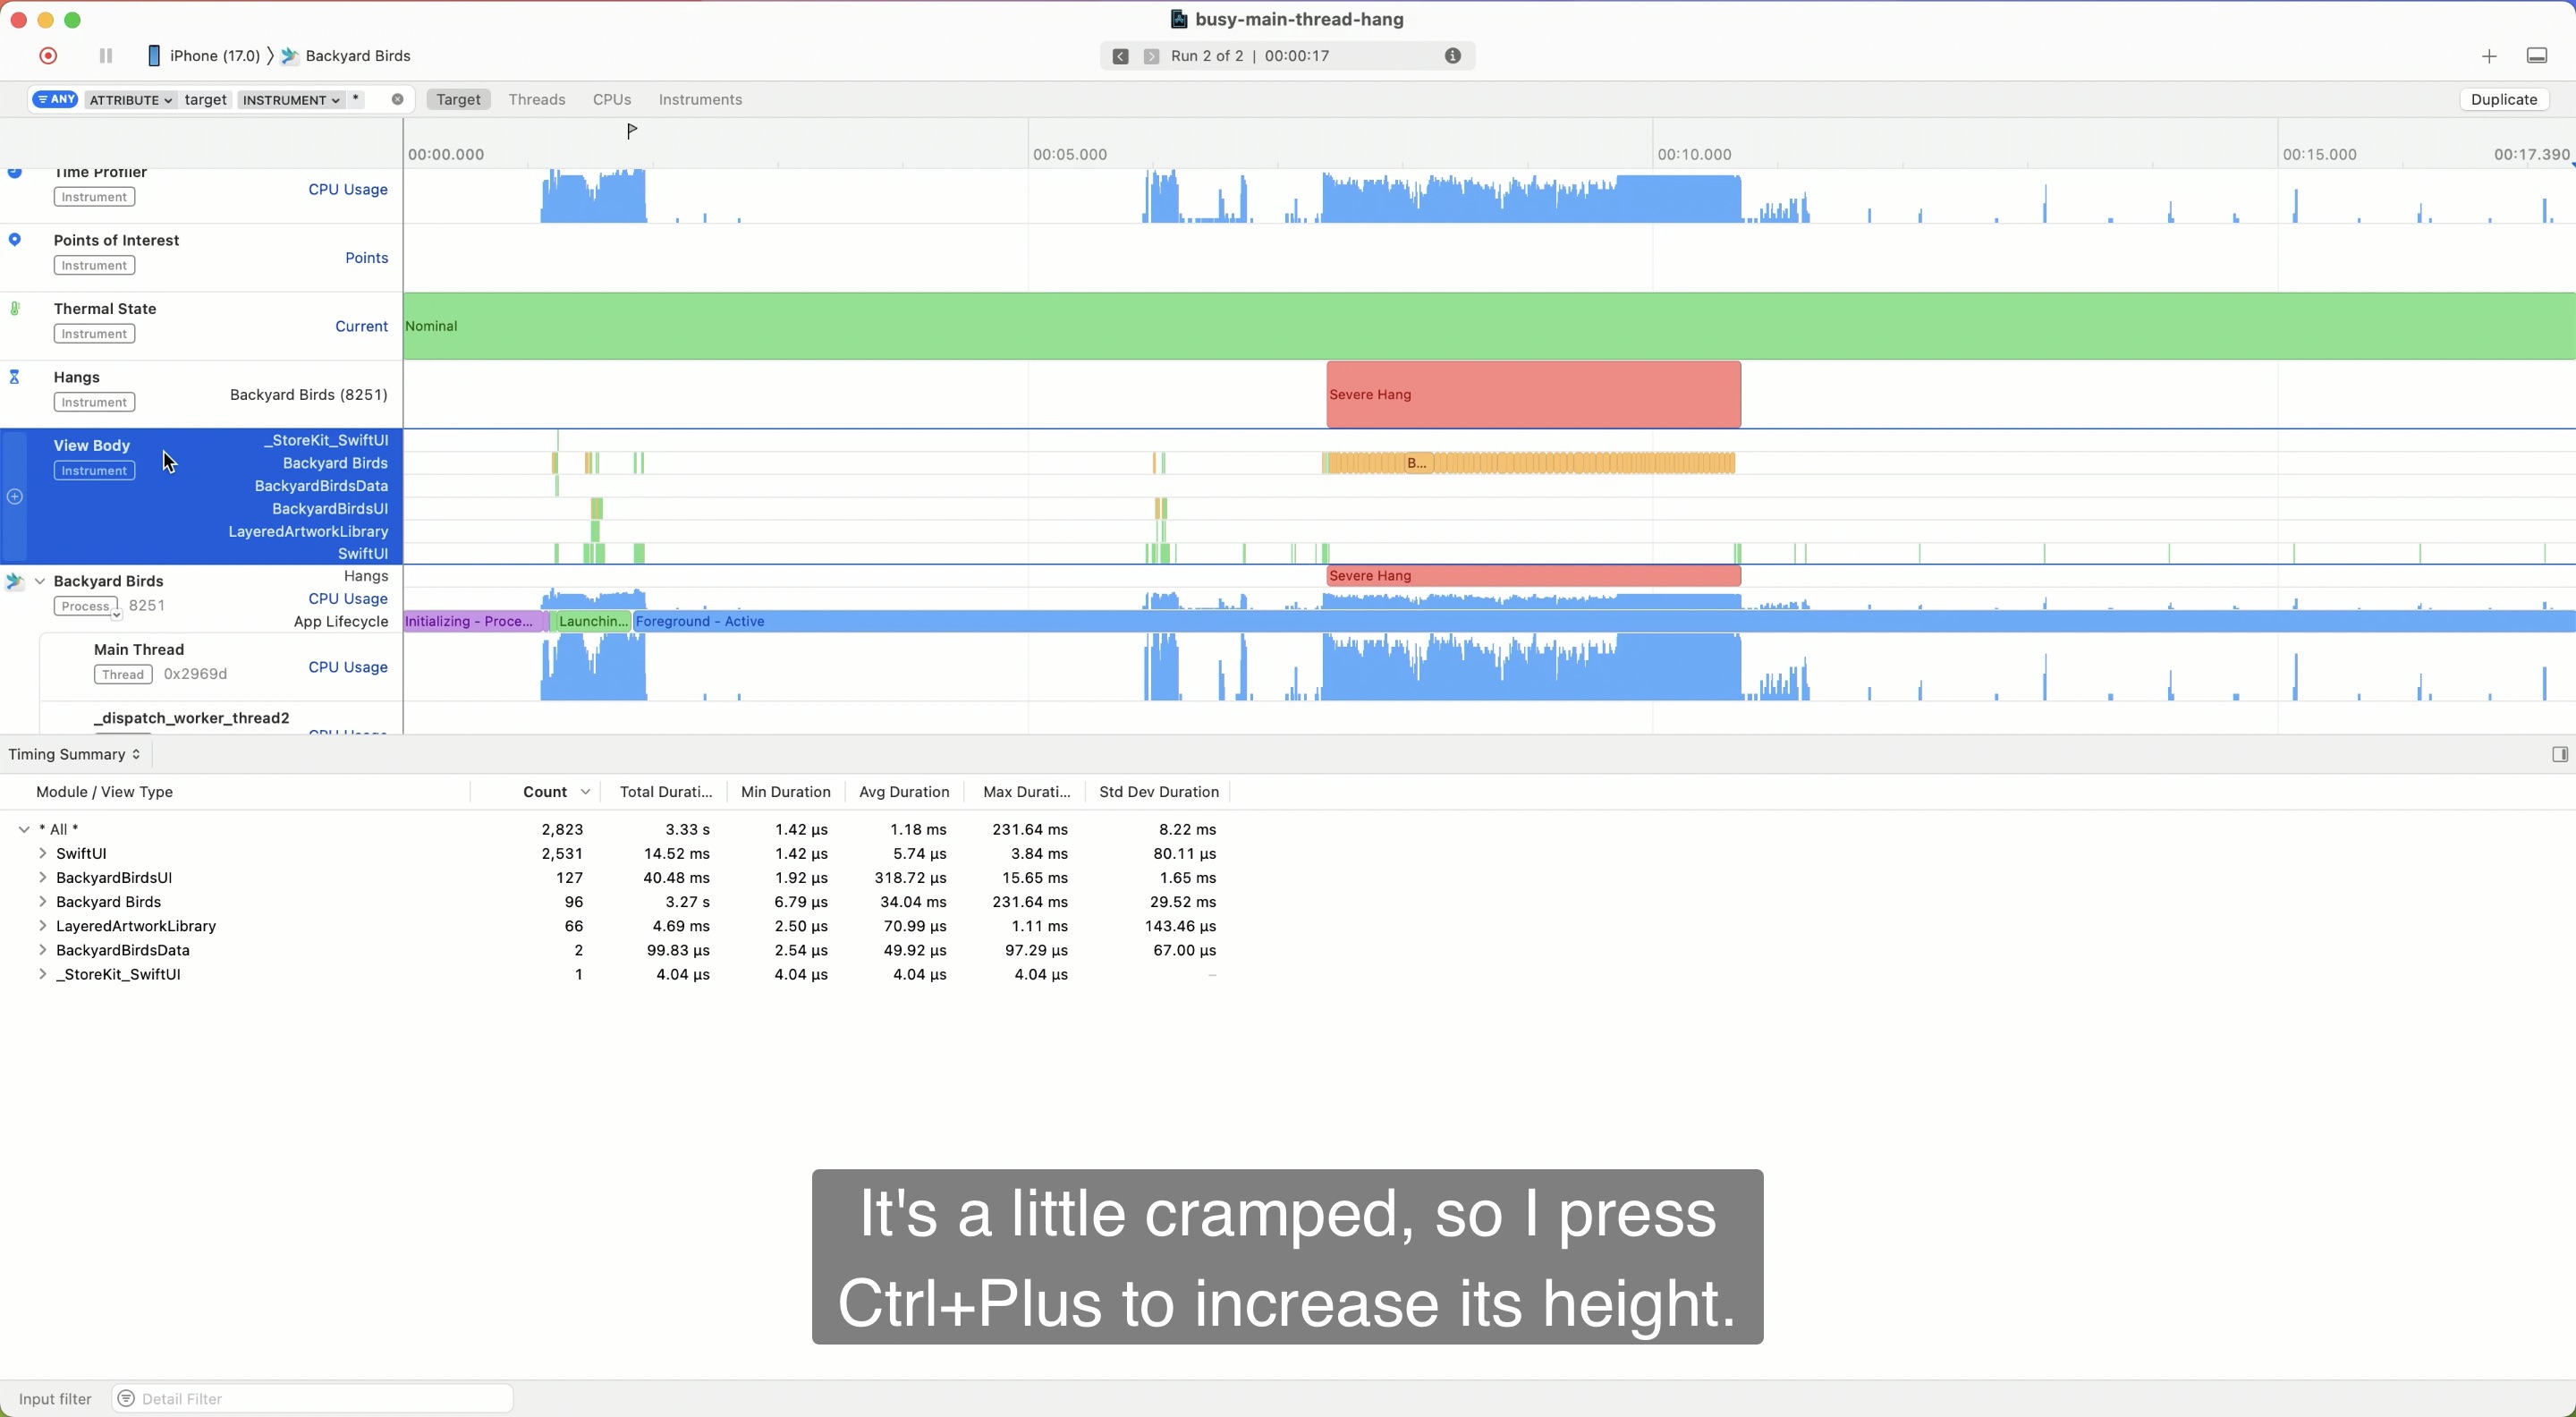
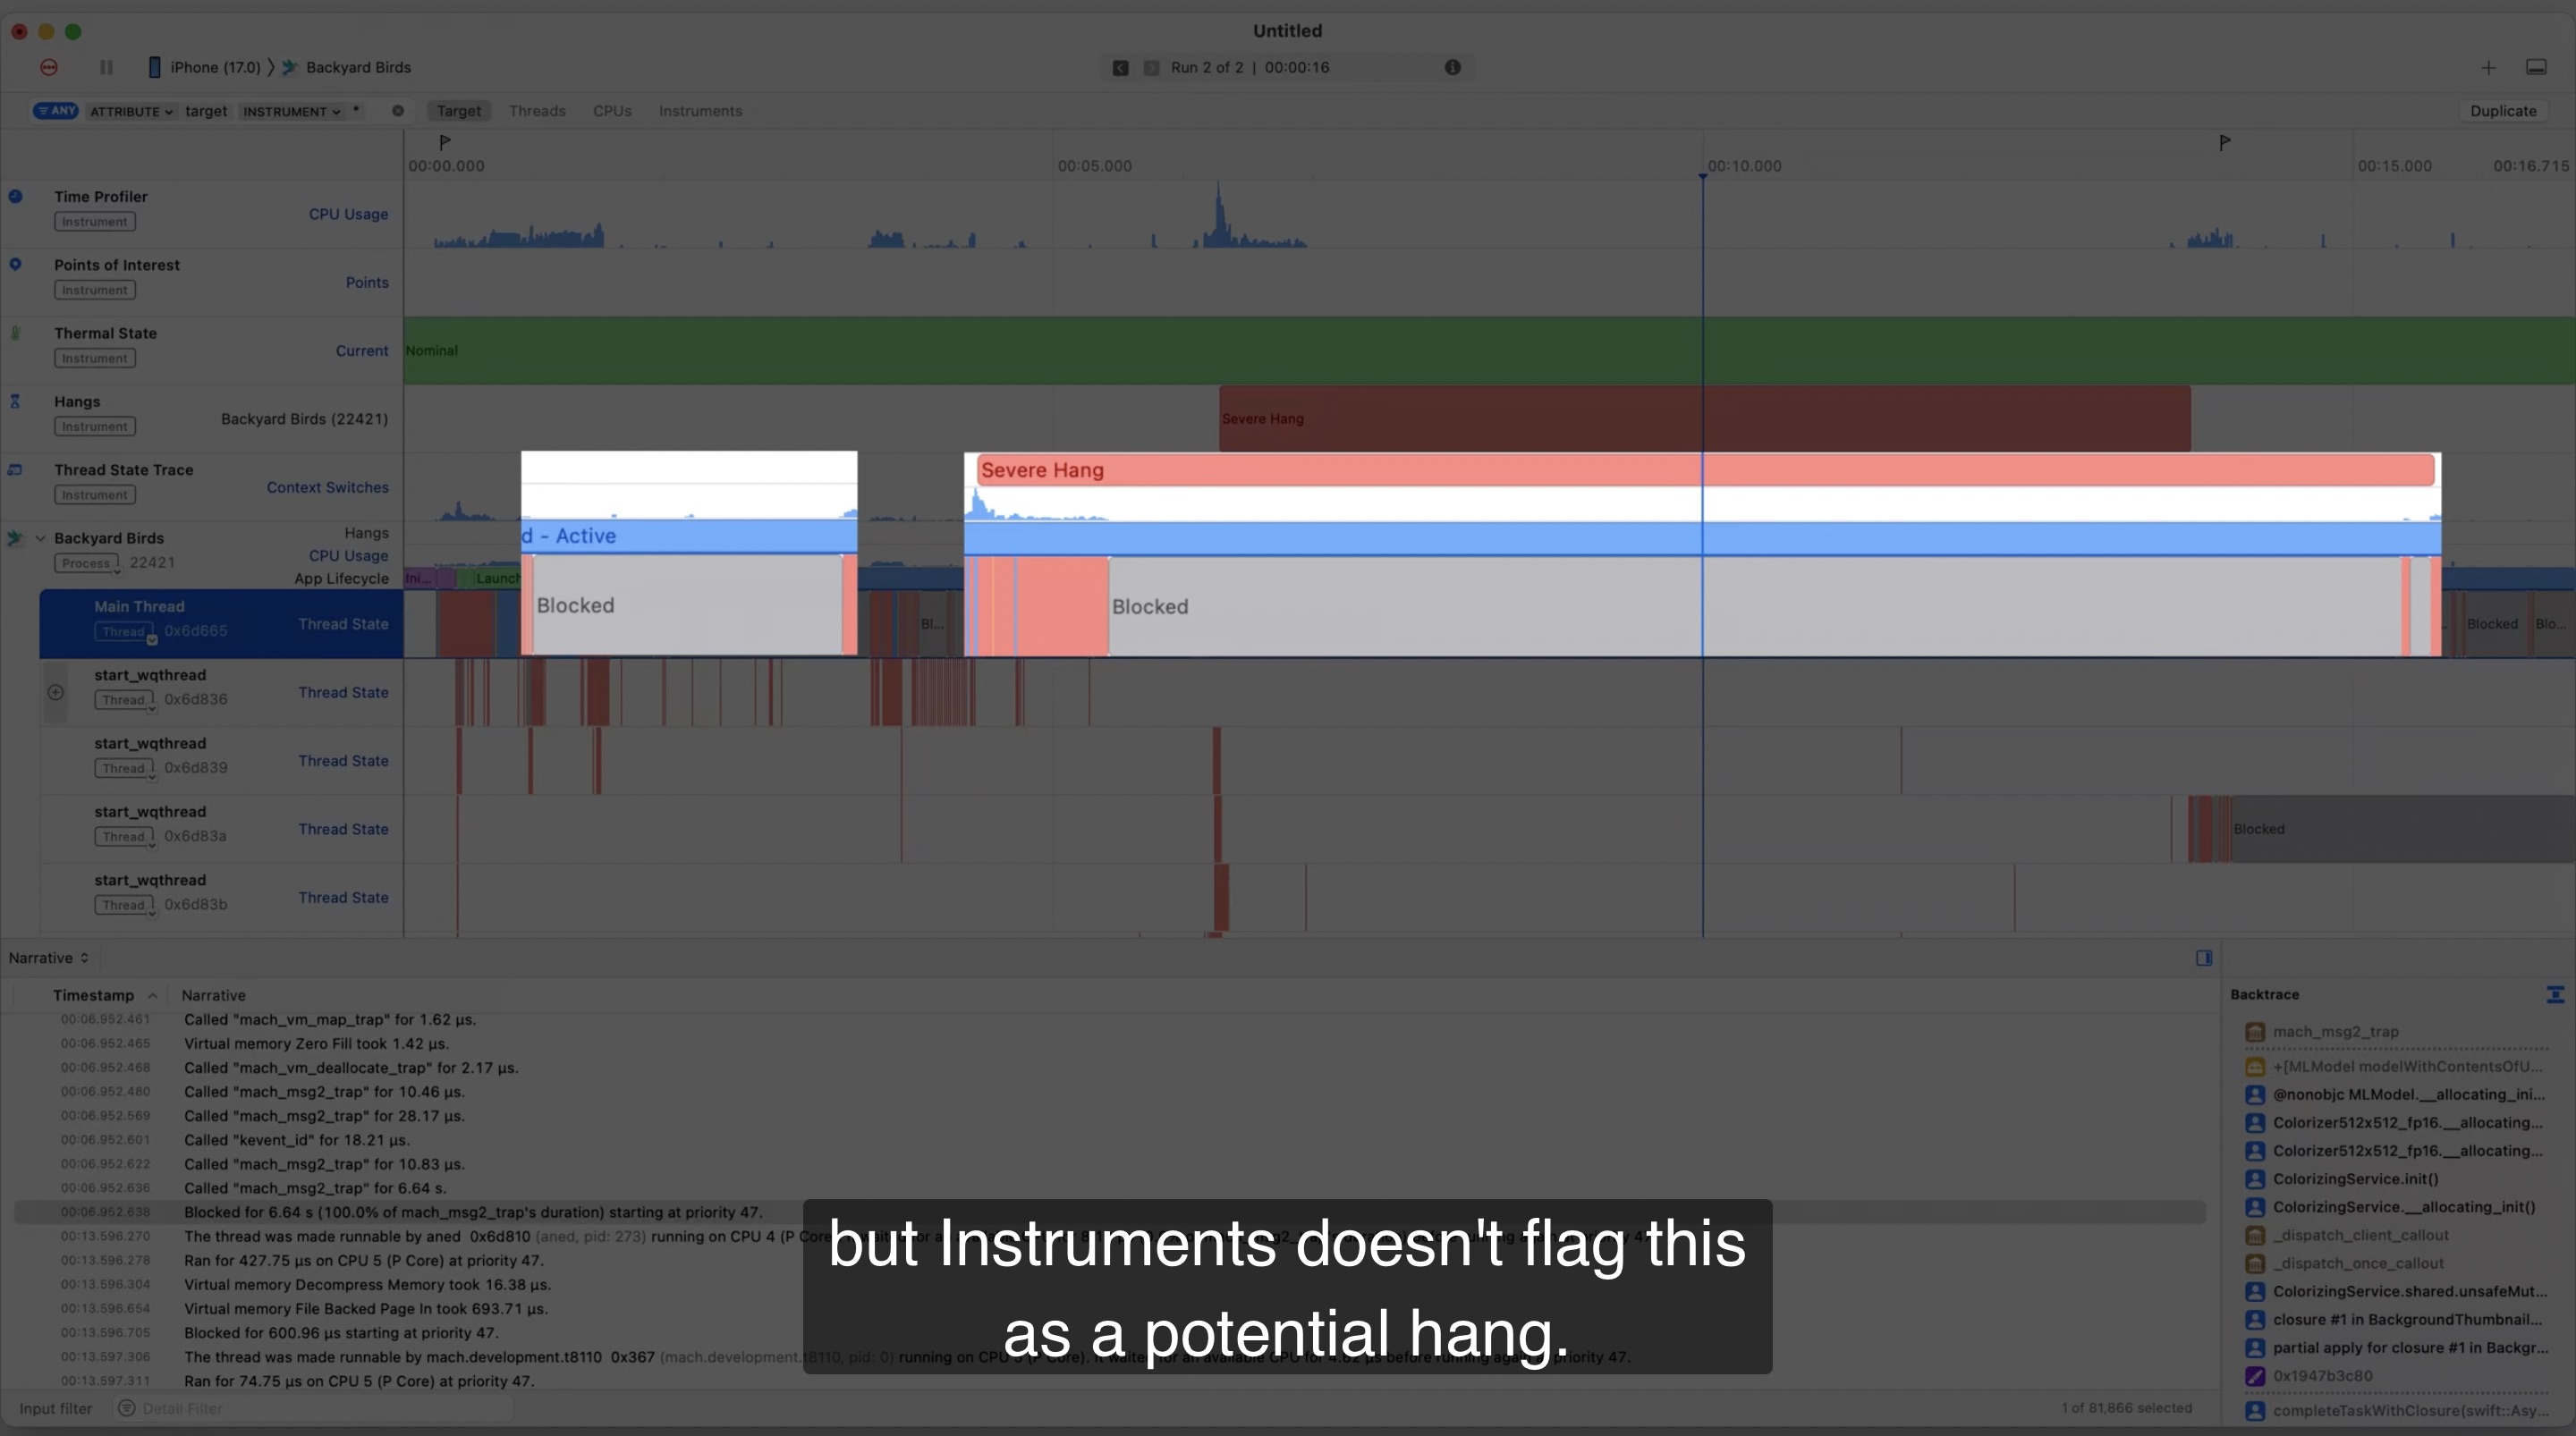
Instruments has also detected the hang. It measures the hang duration, and labels the corresponding intervals according to the severity. In this case, instruments shows us a “Server Hang” has happened (see above screenshot).
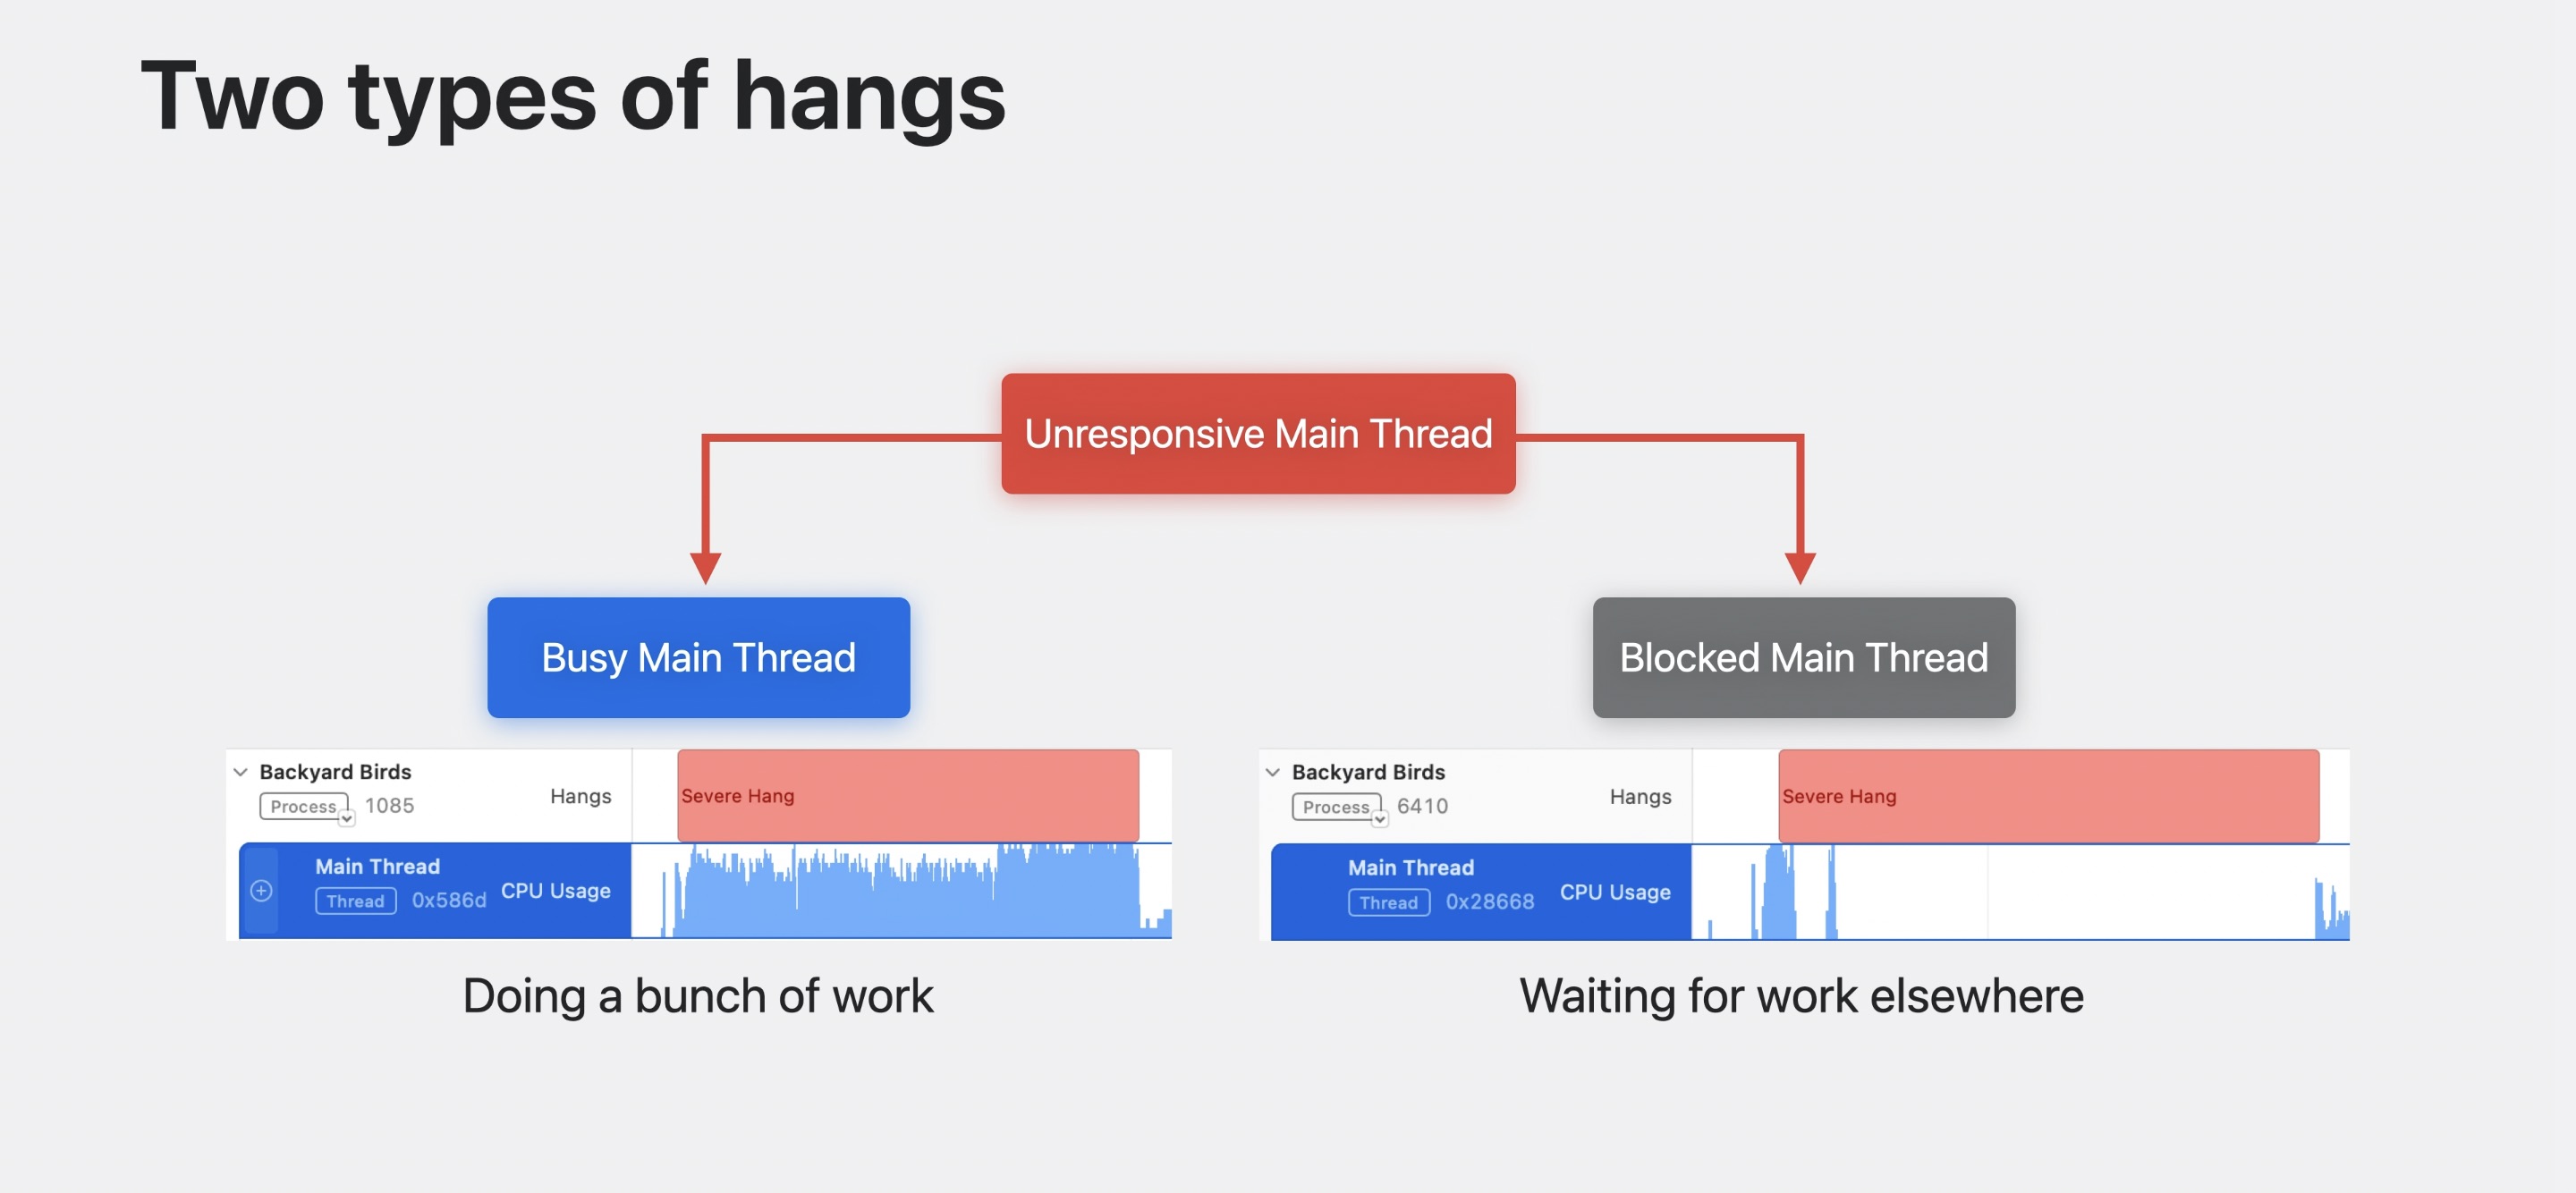
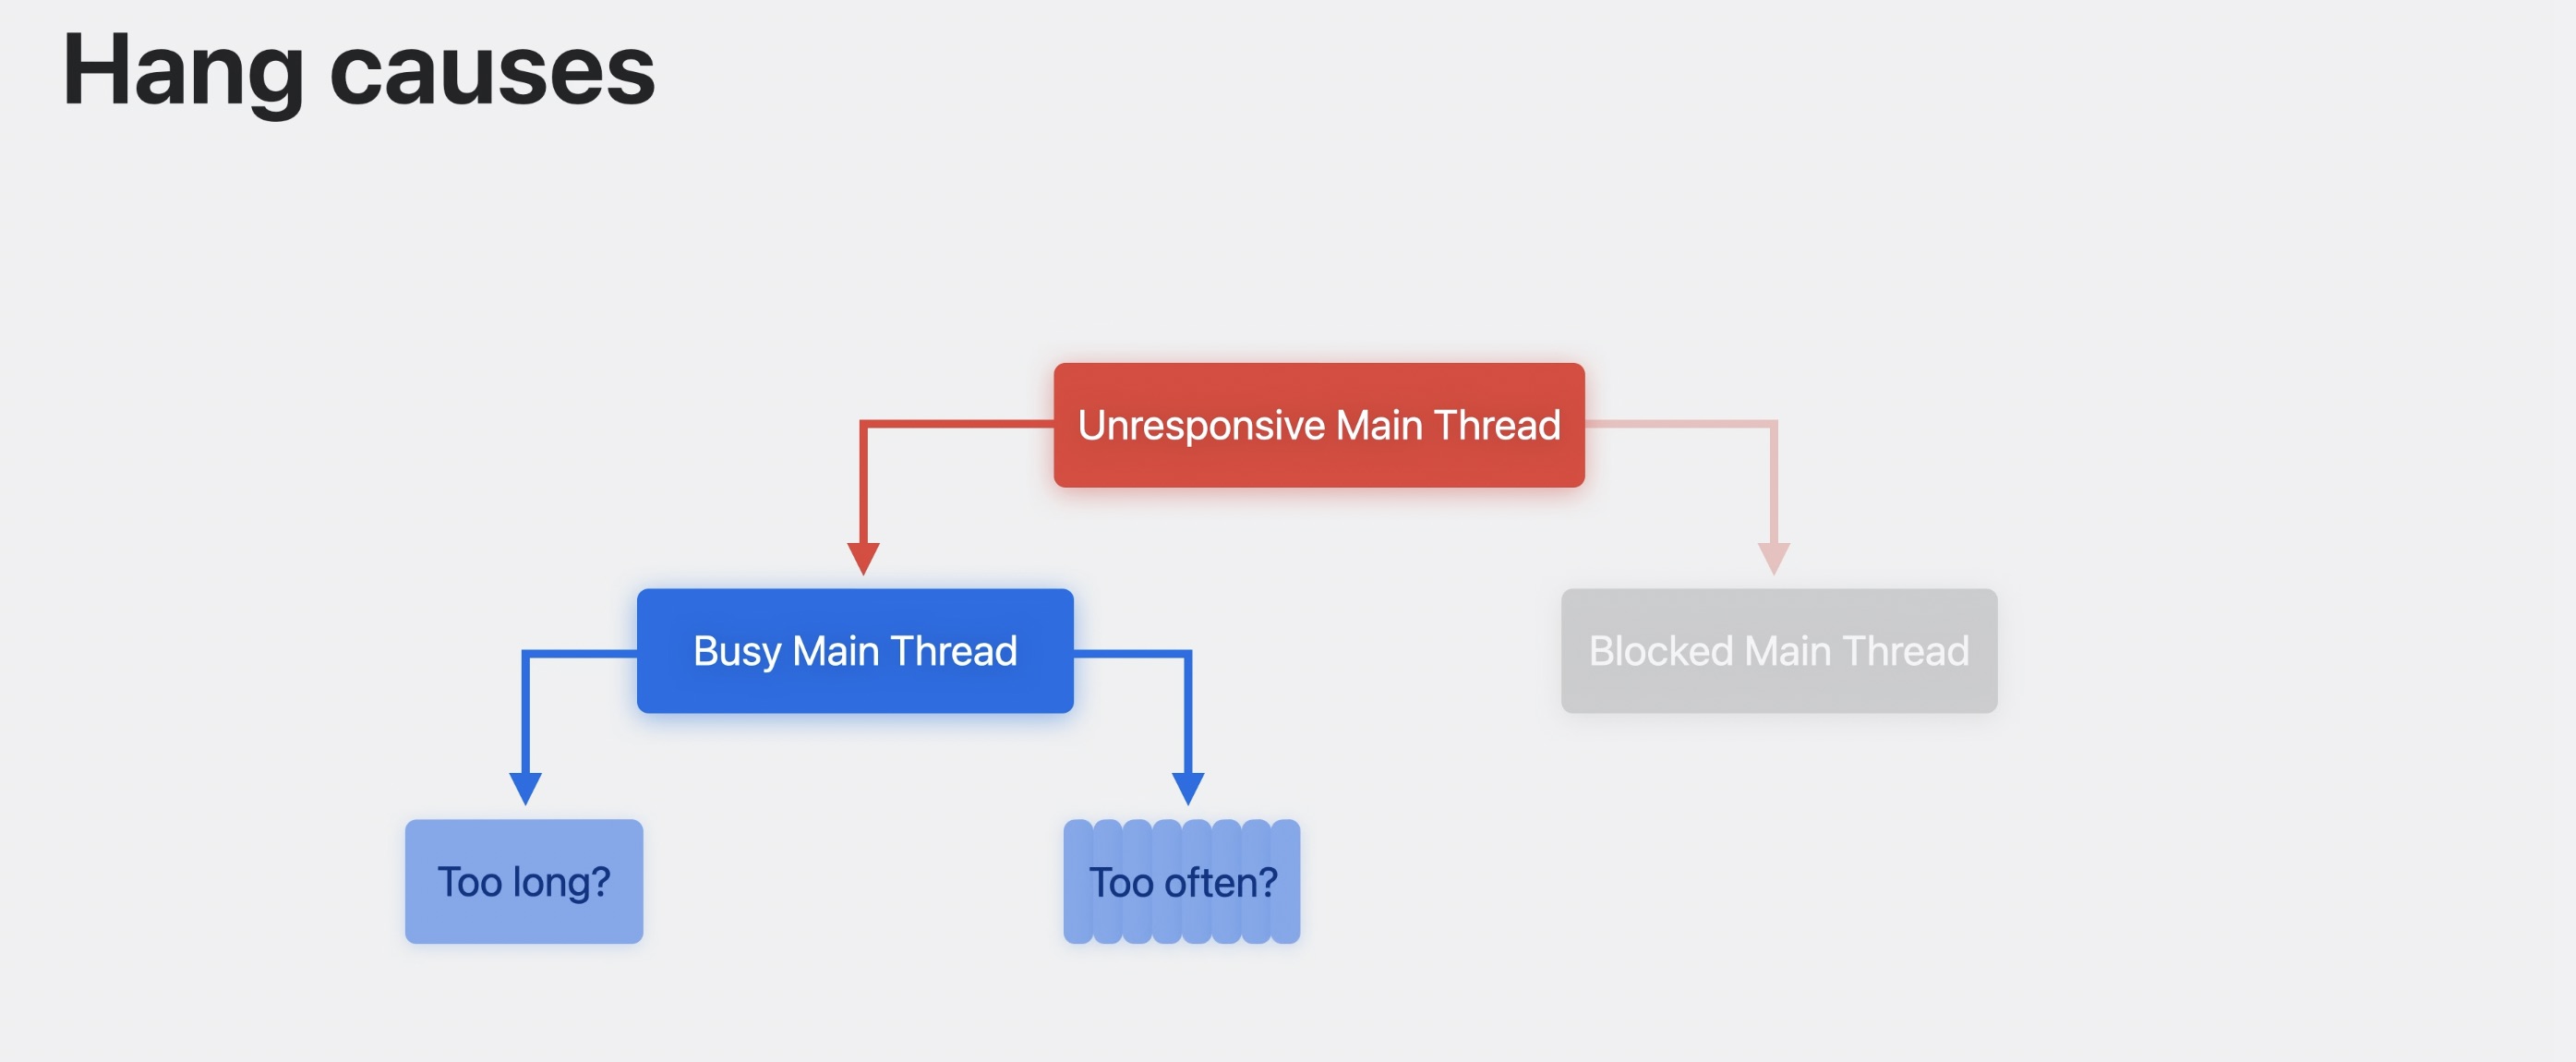
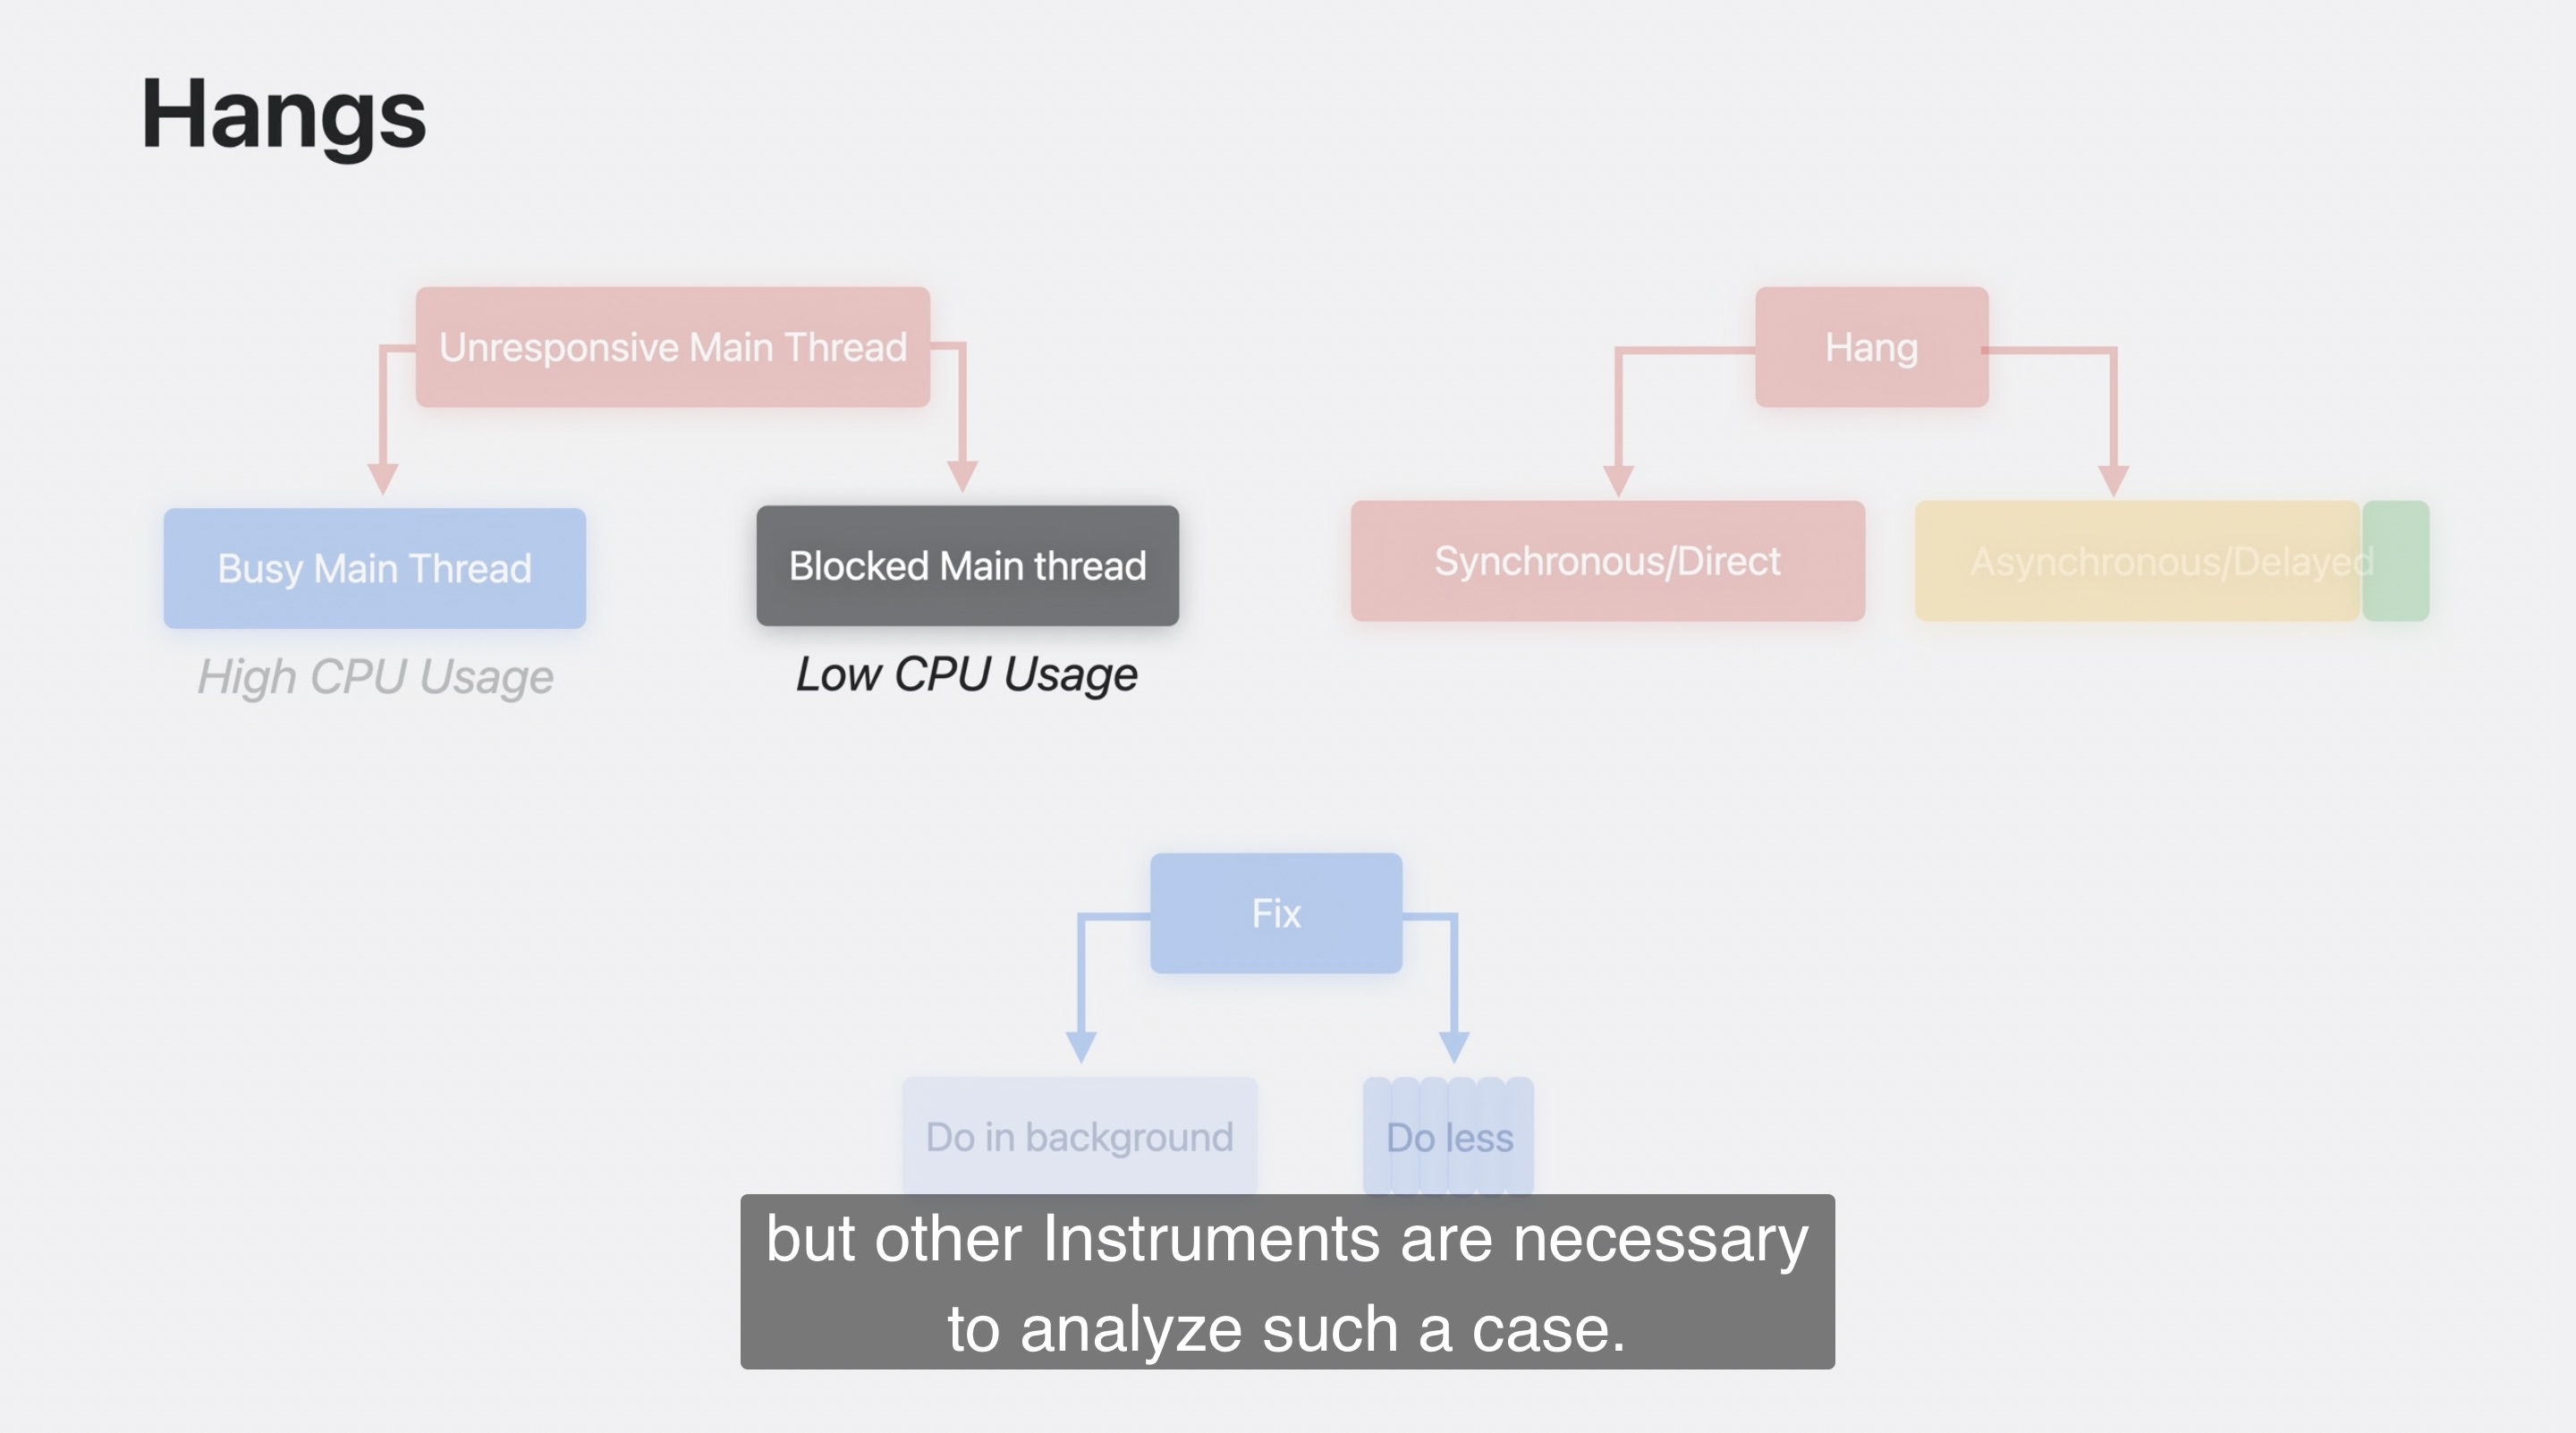
There are two main cases for an unresponsive main thread:
- The most simple case is that the main thread is simply still busy doing other work. In this case, the main thread will show a bunch of CPU activity.
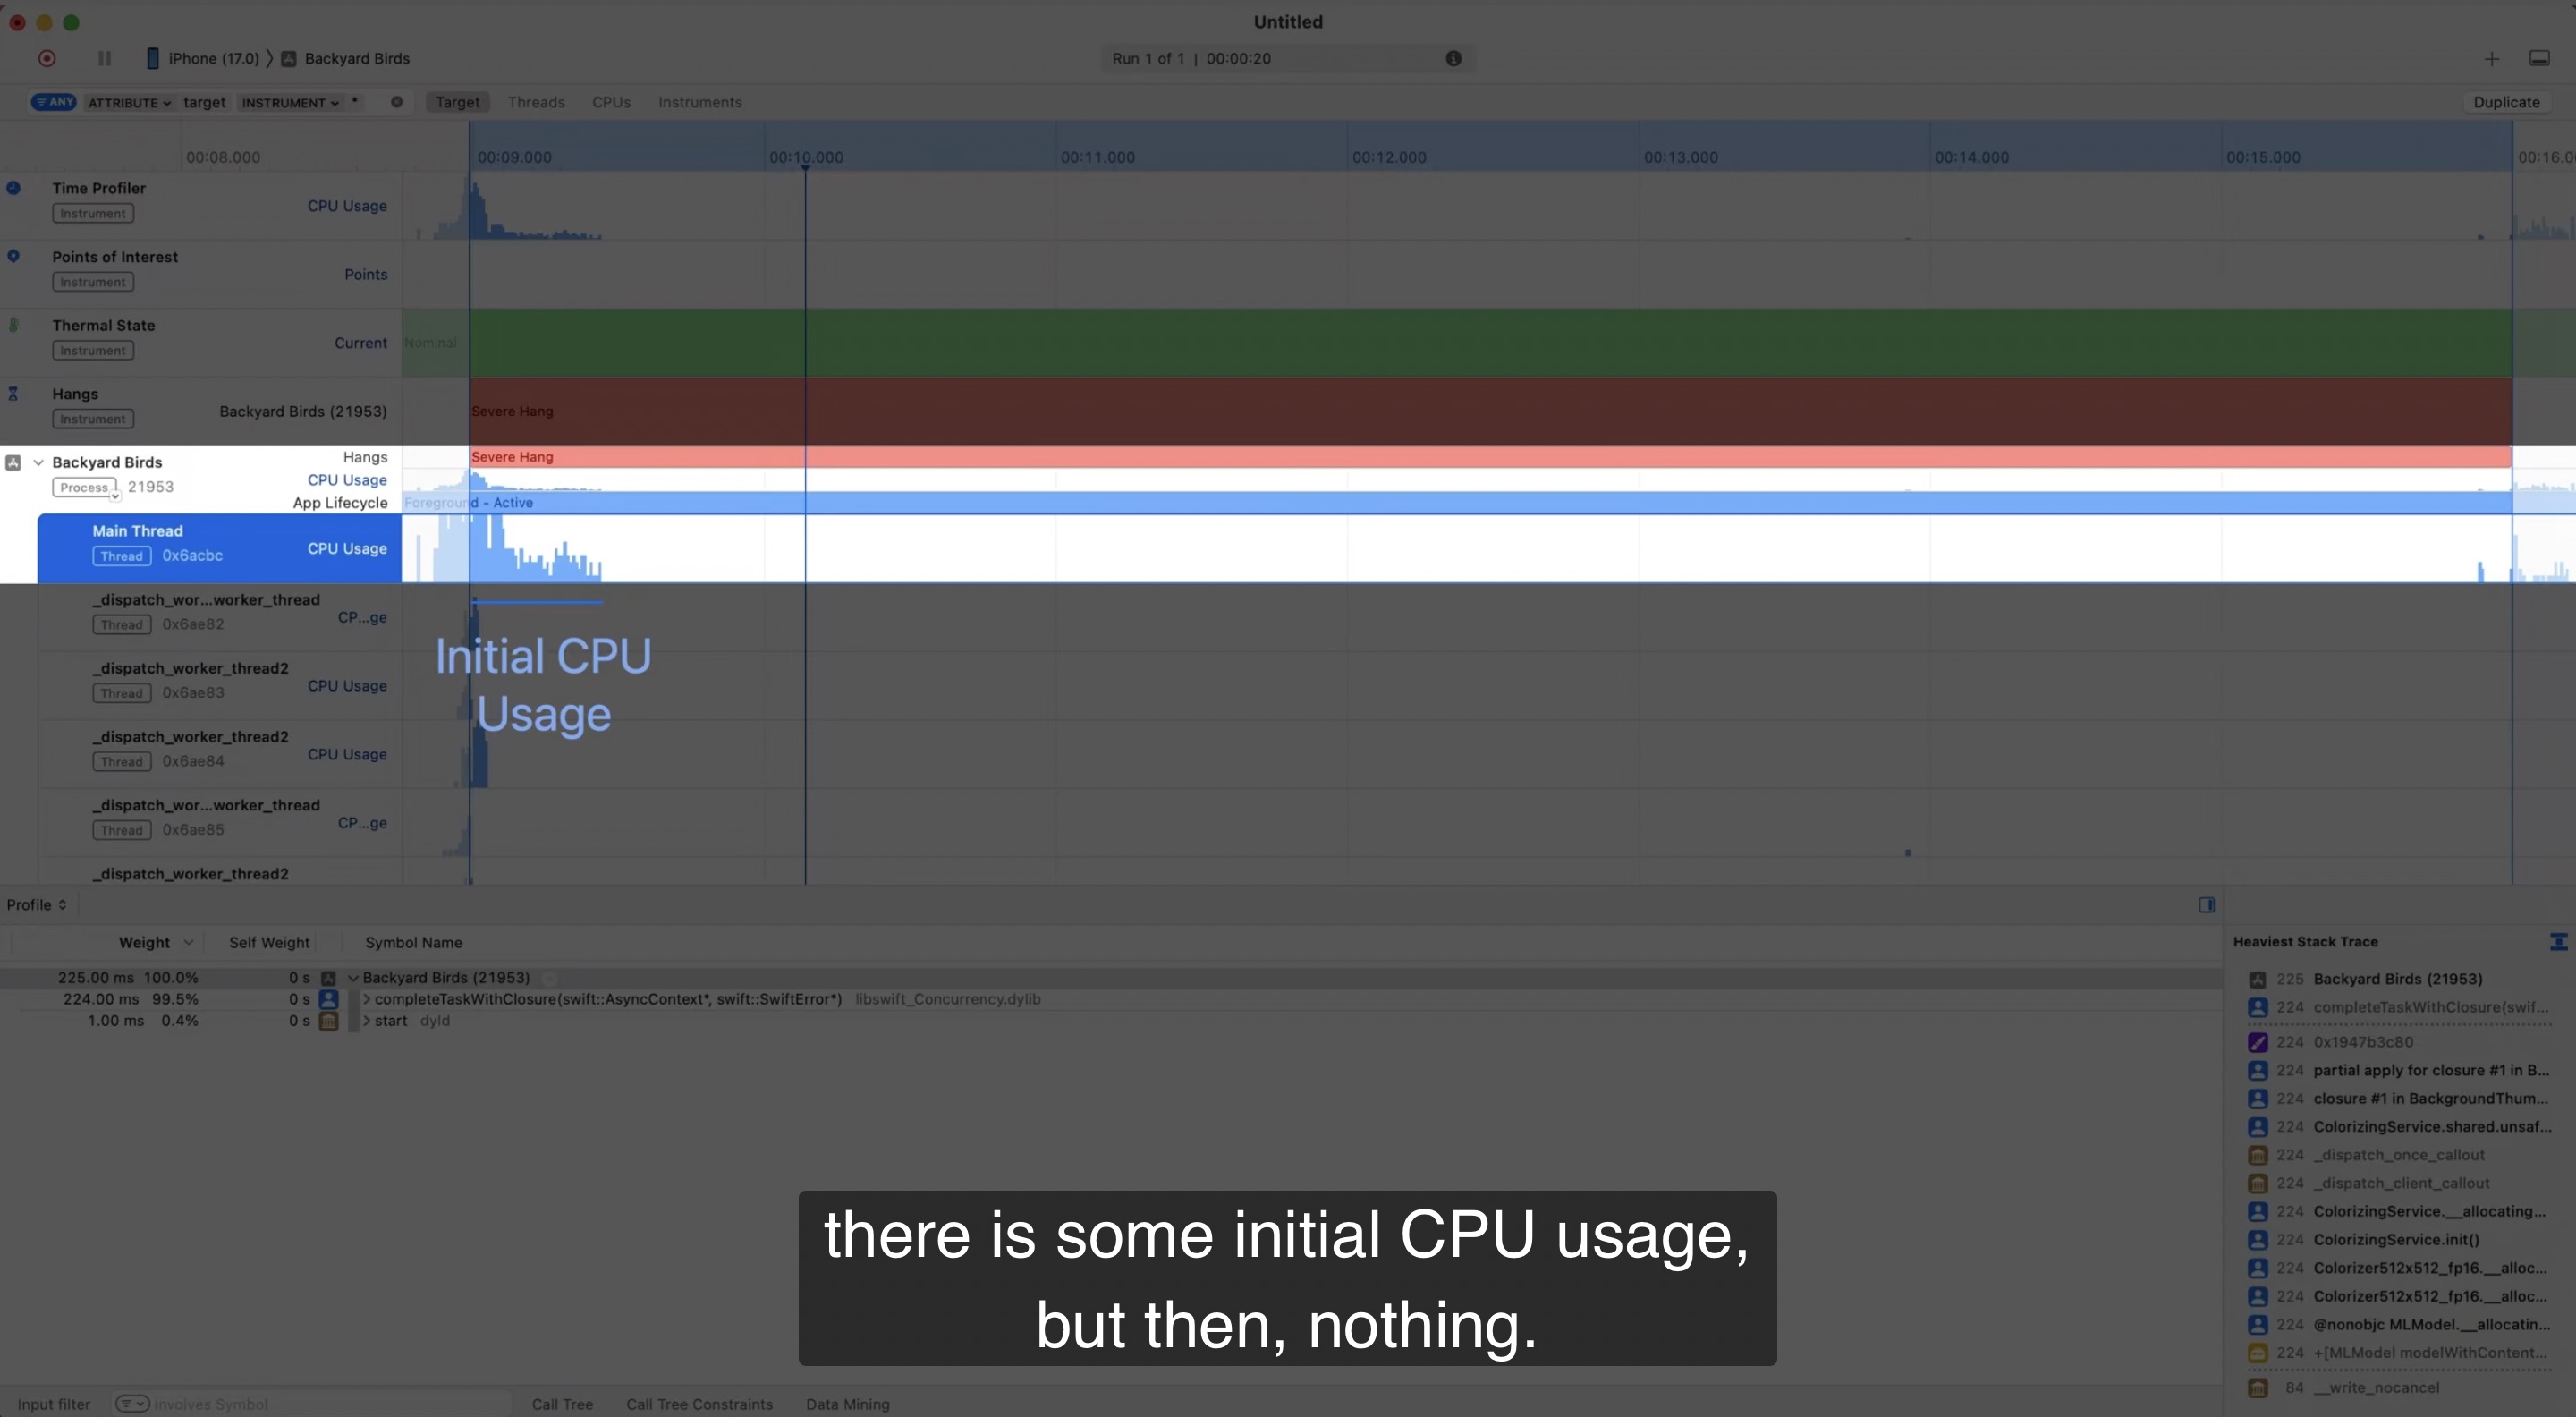
- The other case is the main thread being blocked. This is usually because the main thread is waiting for some other work to be done elsewhere. When the thread is blocked, there will be little to no CPU activity on the main thread.
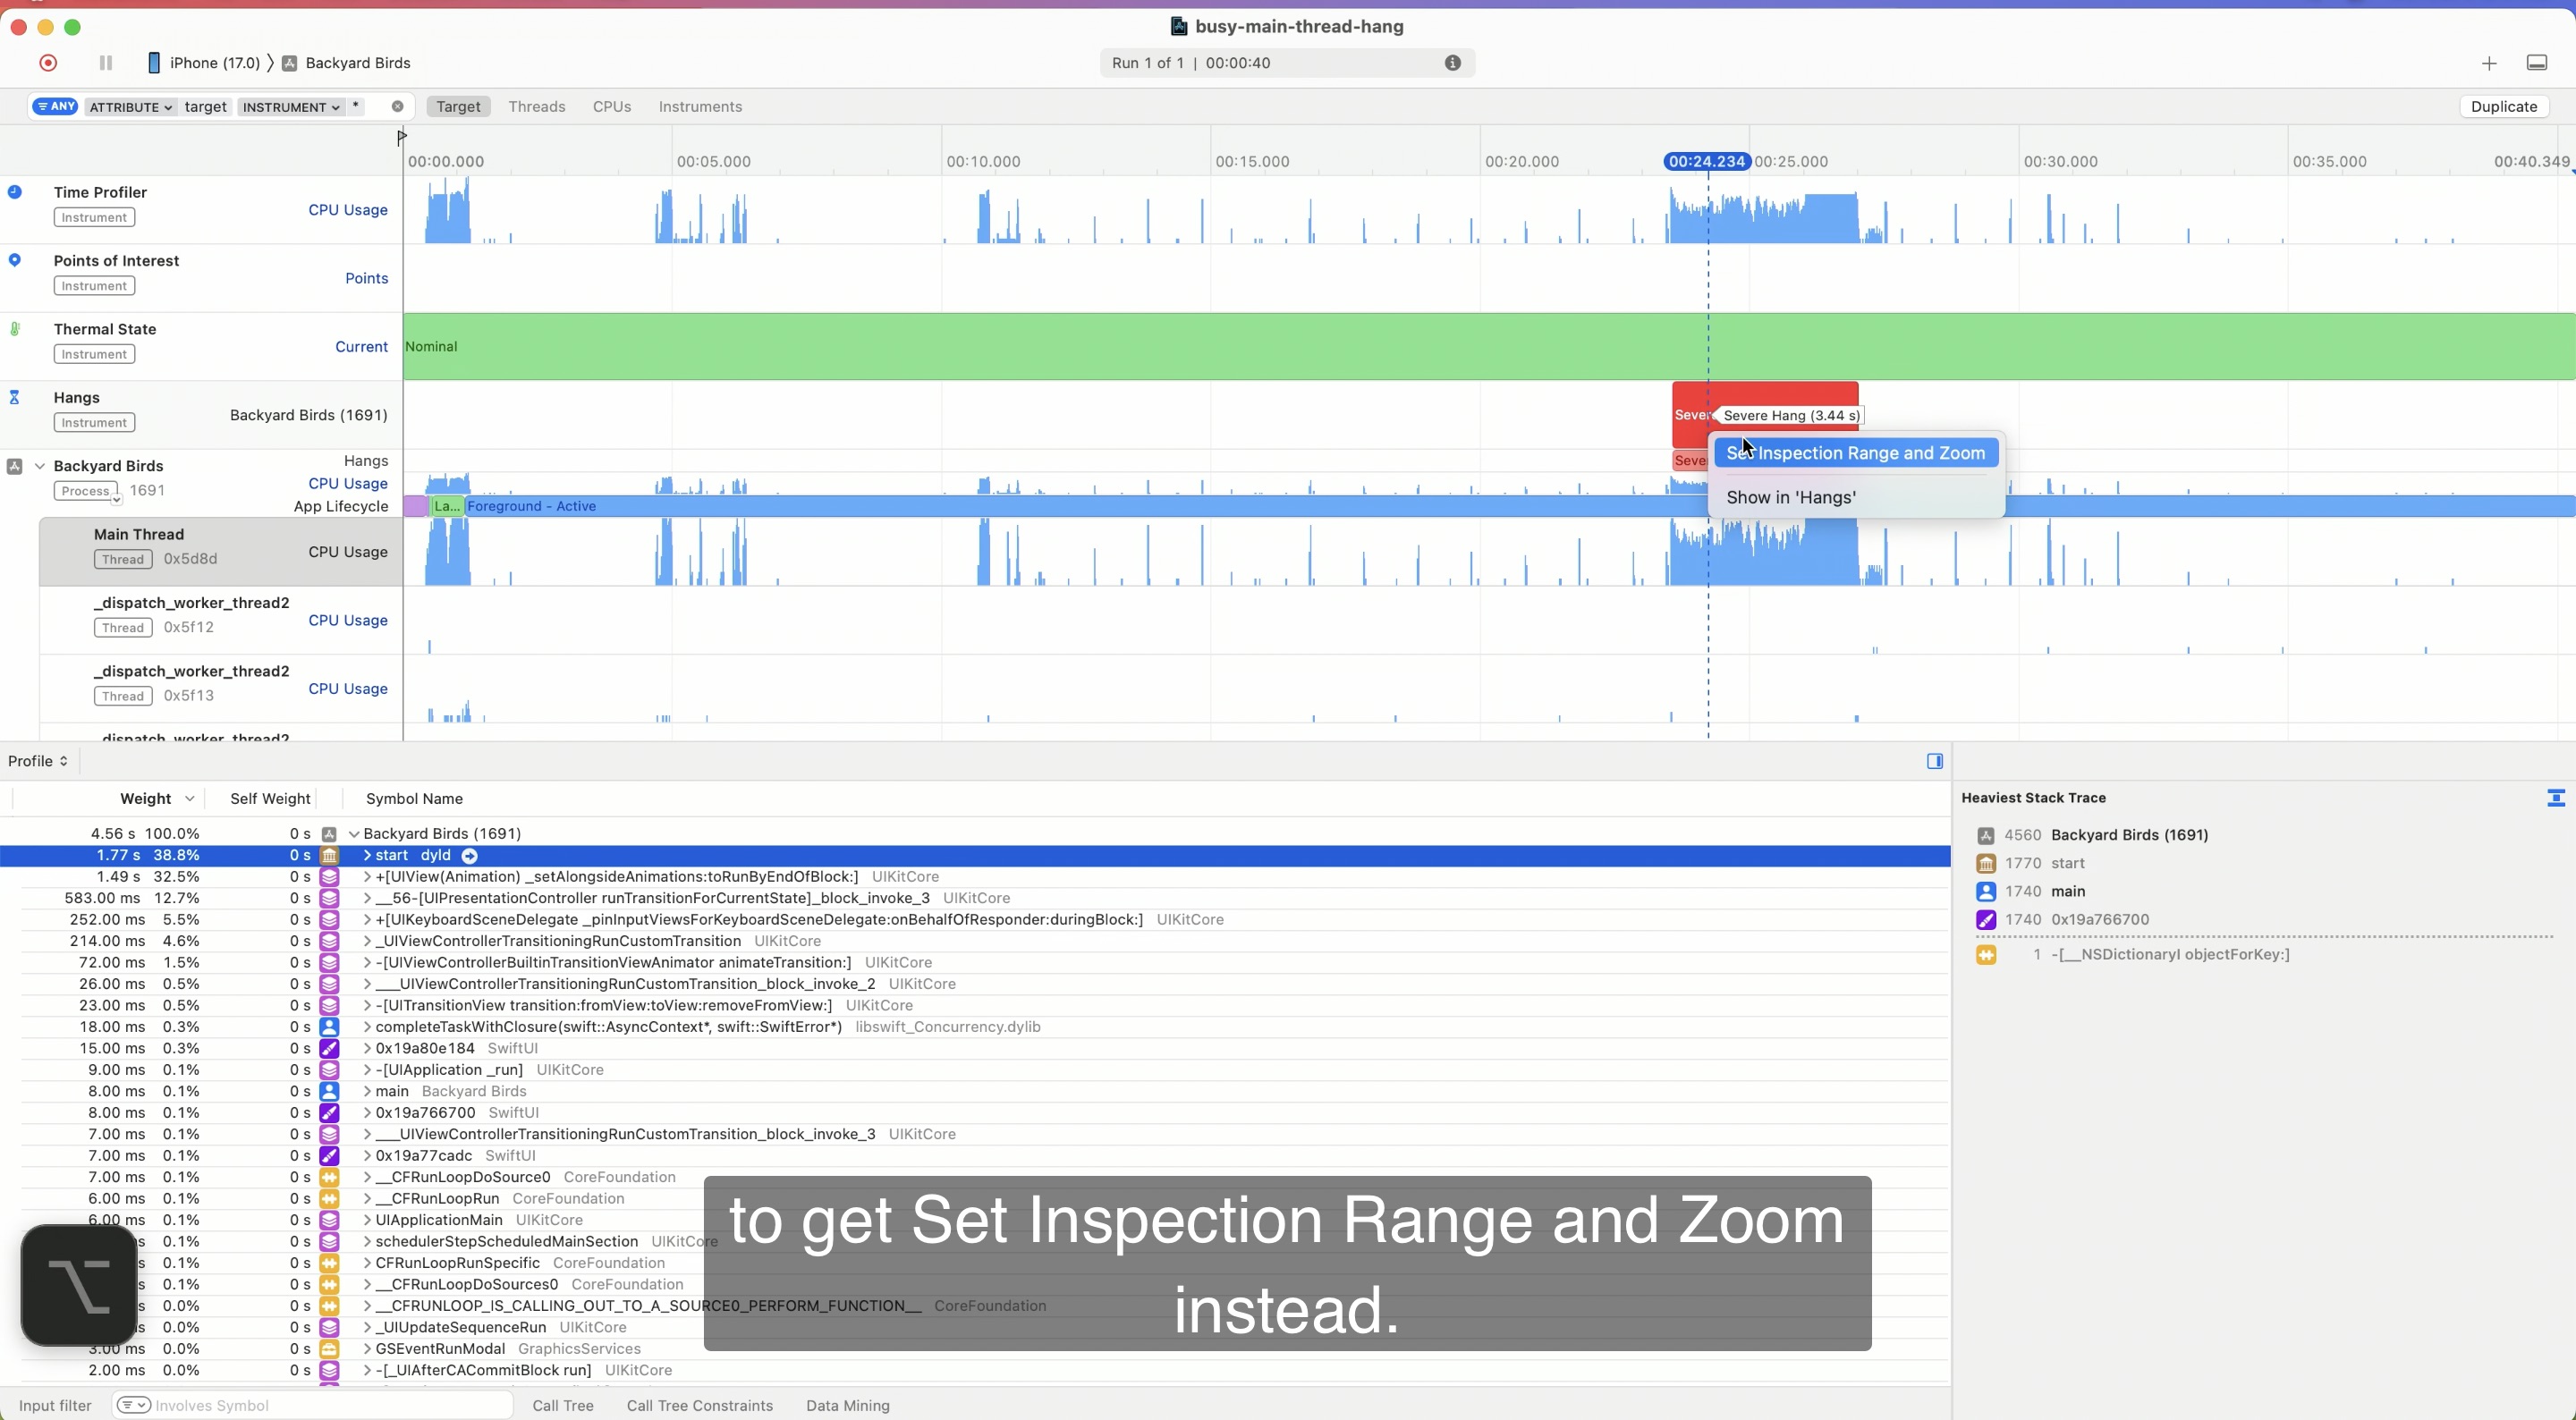
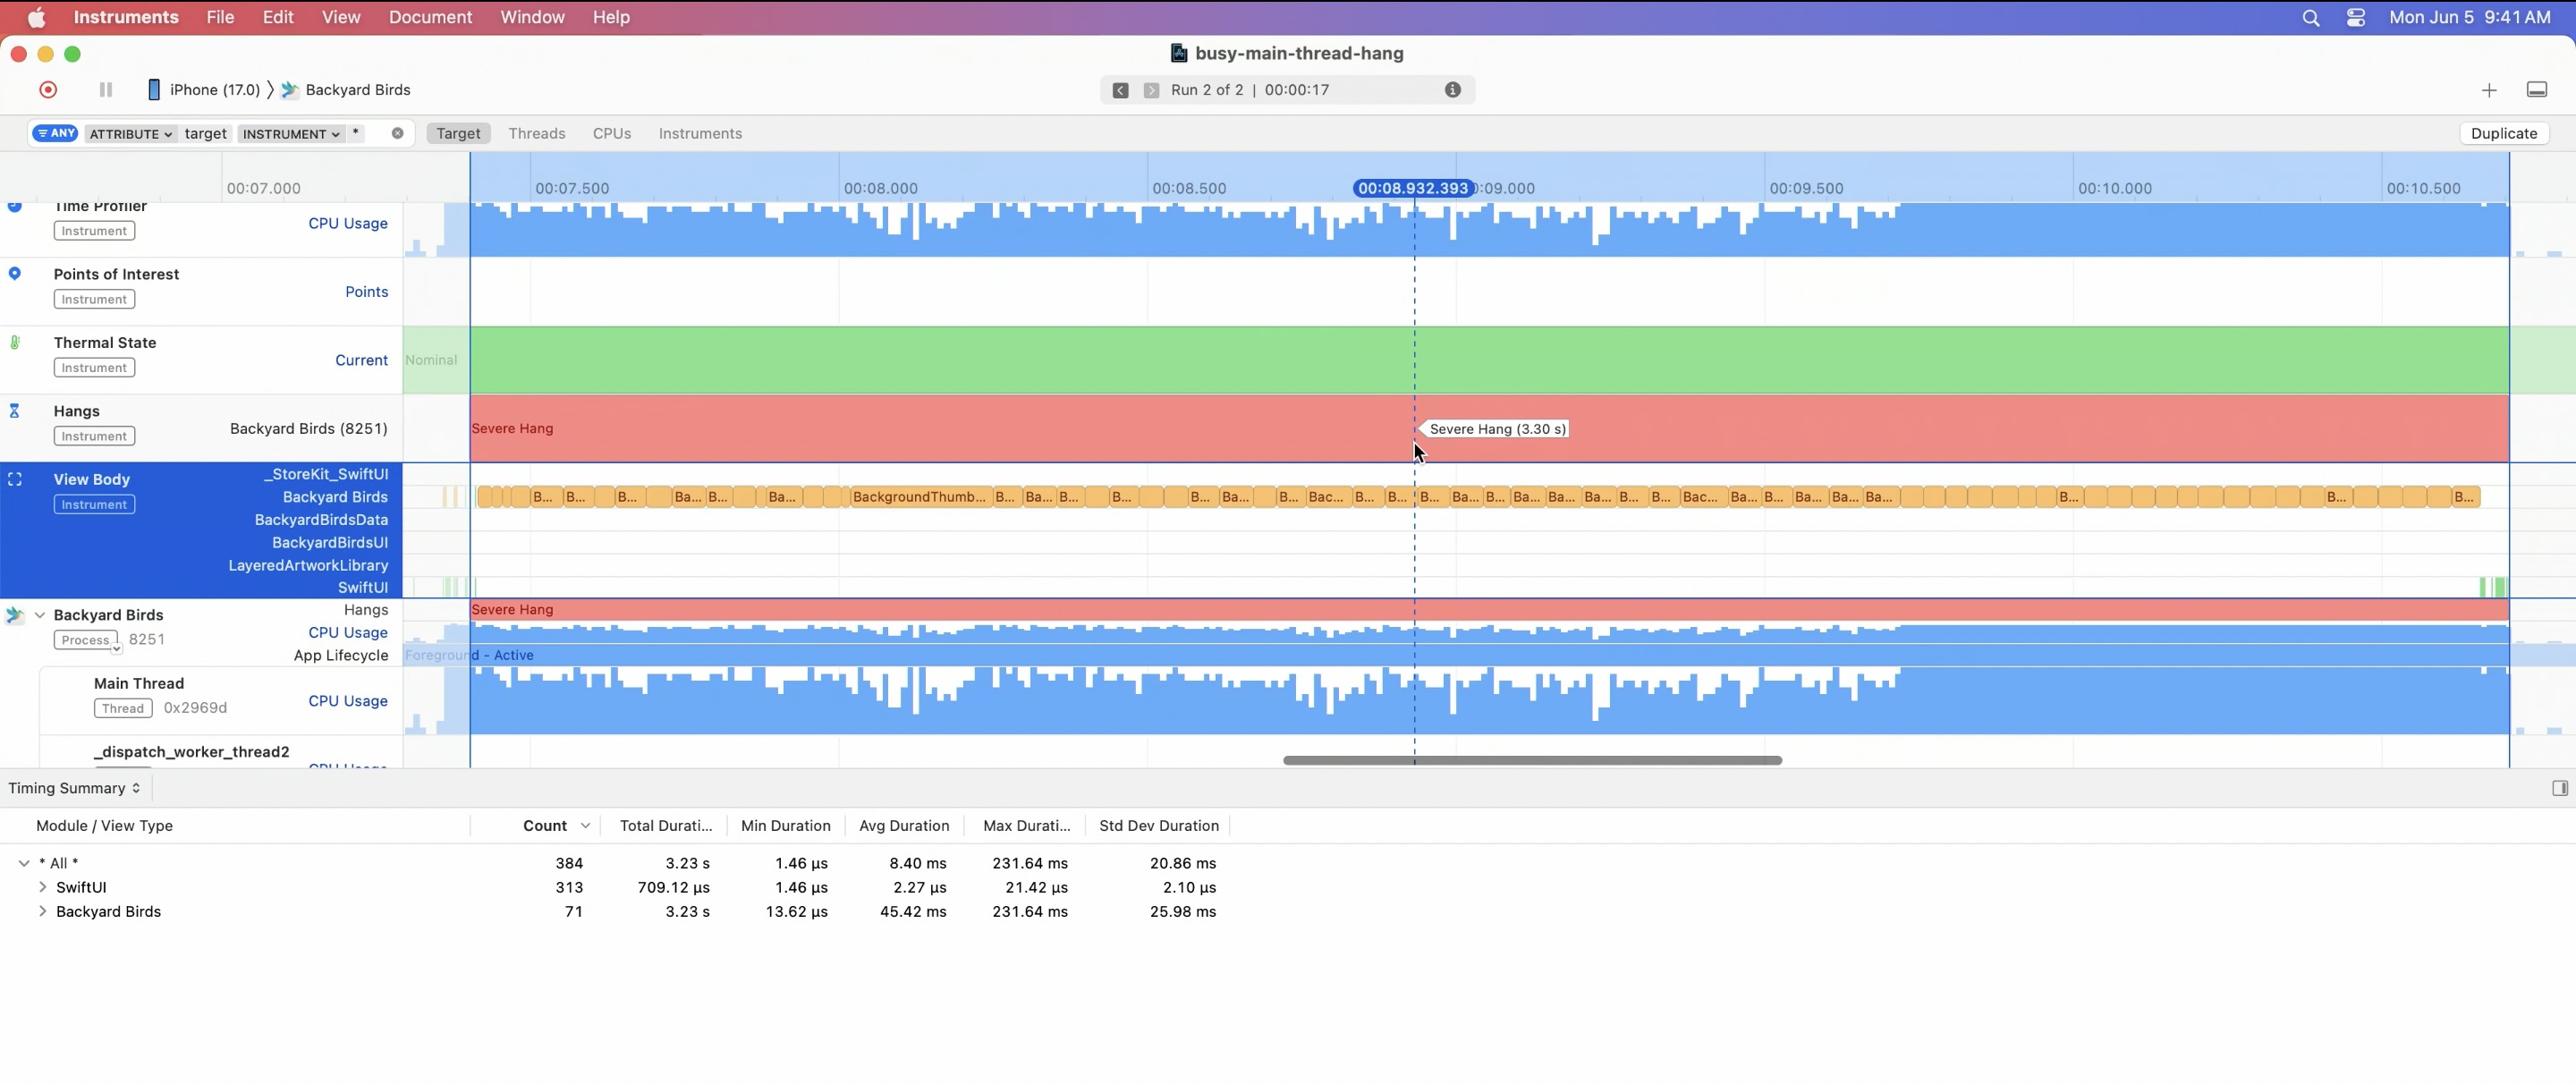
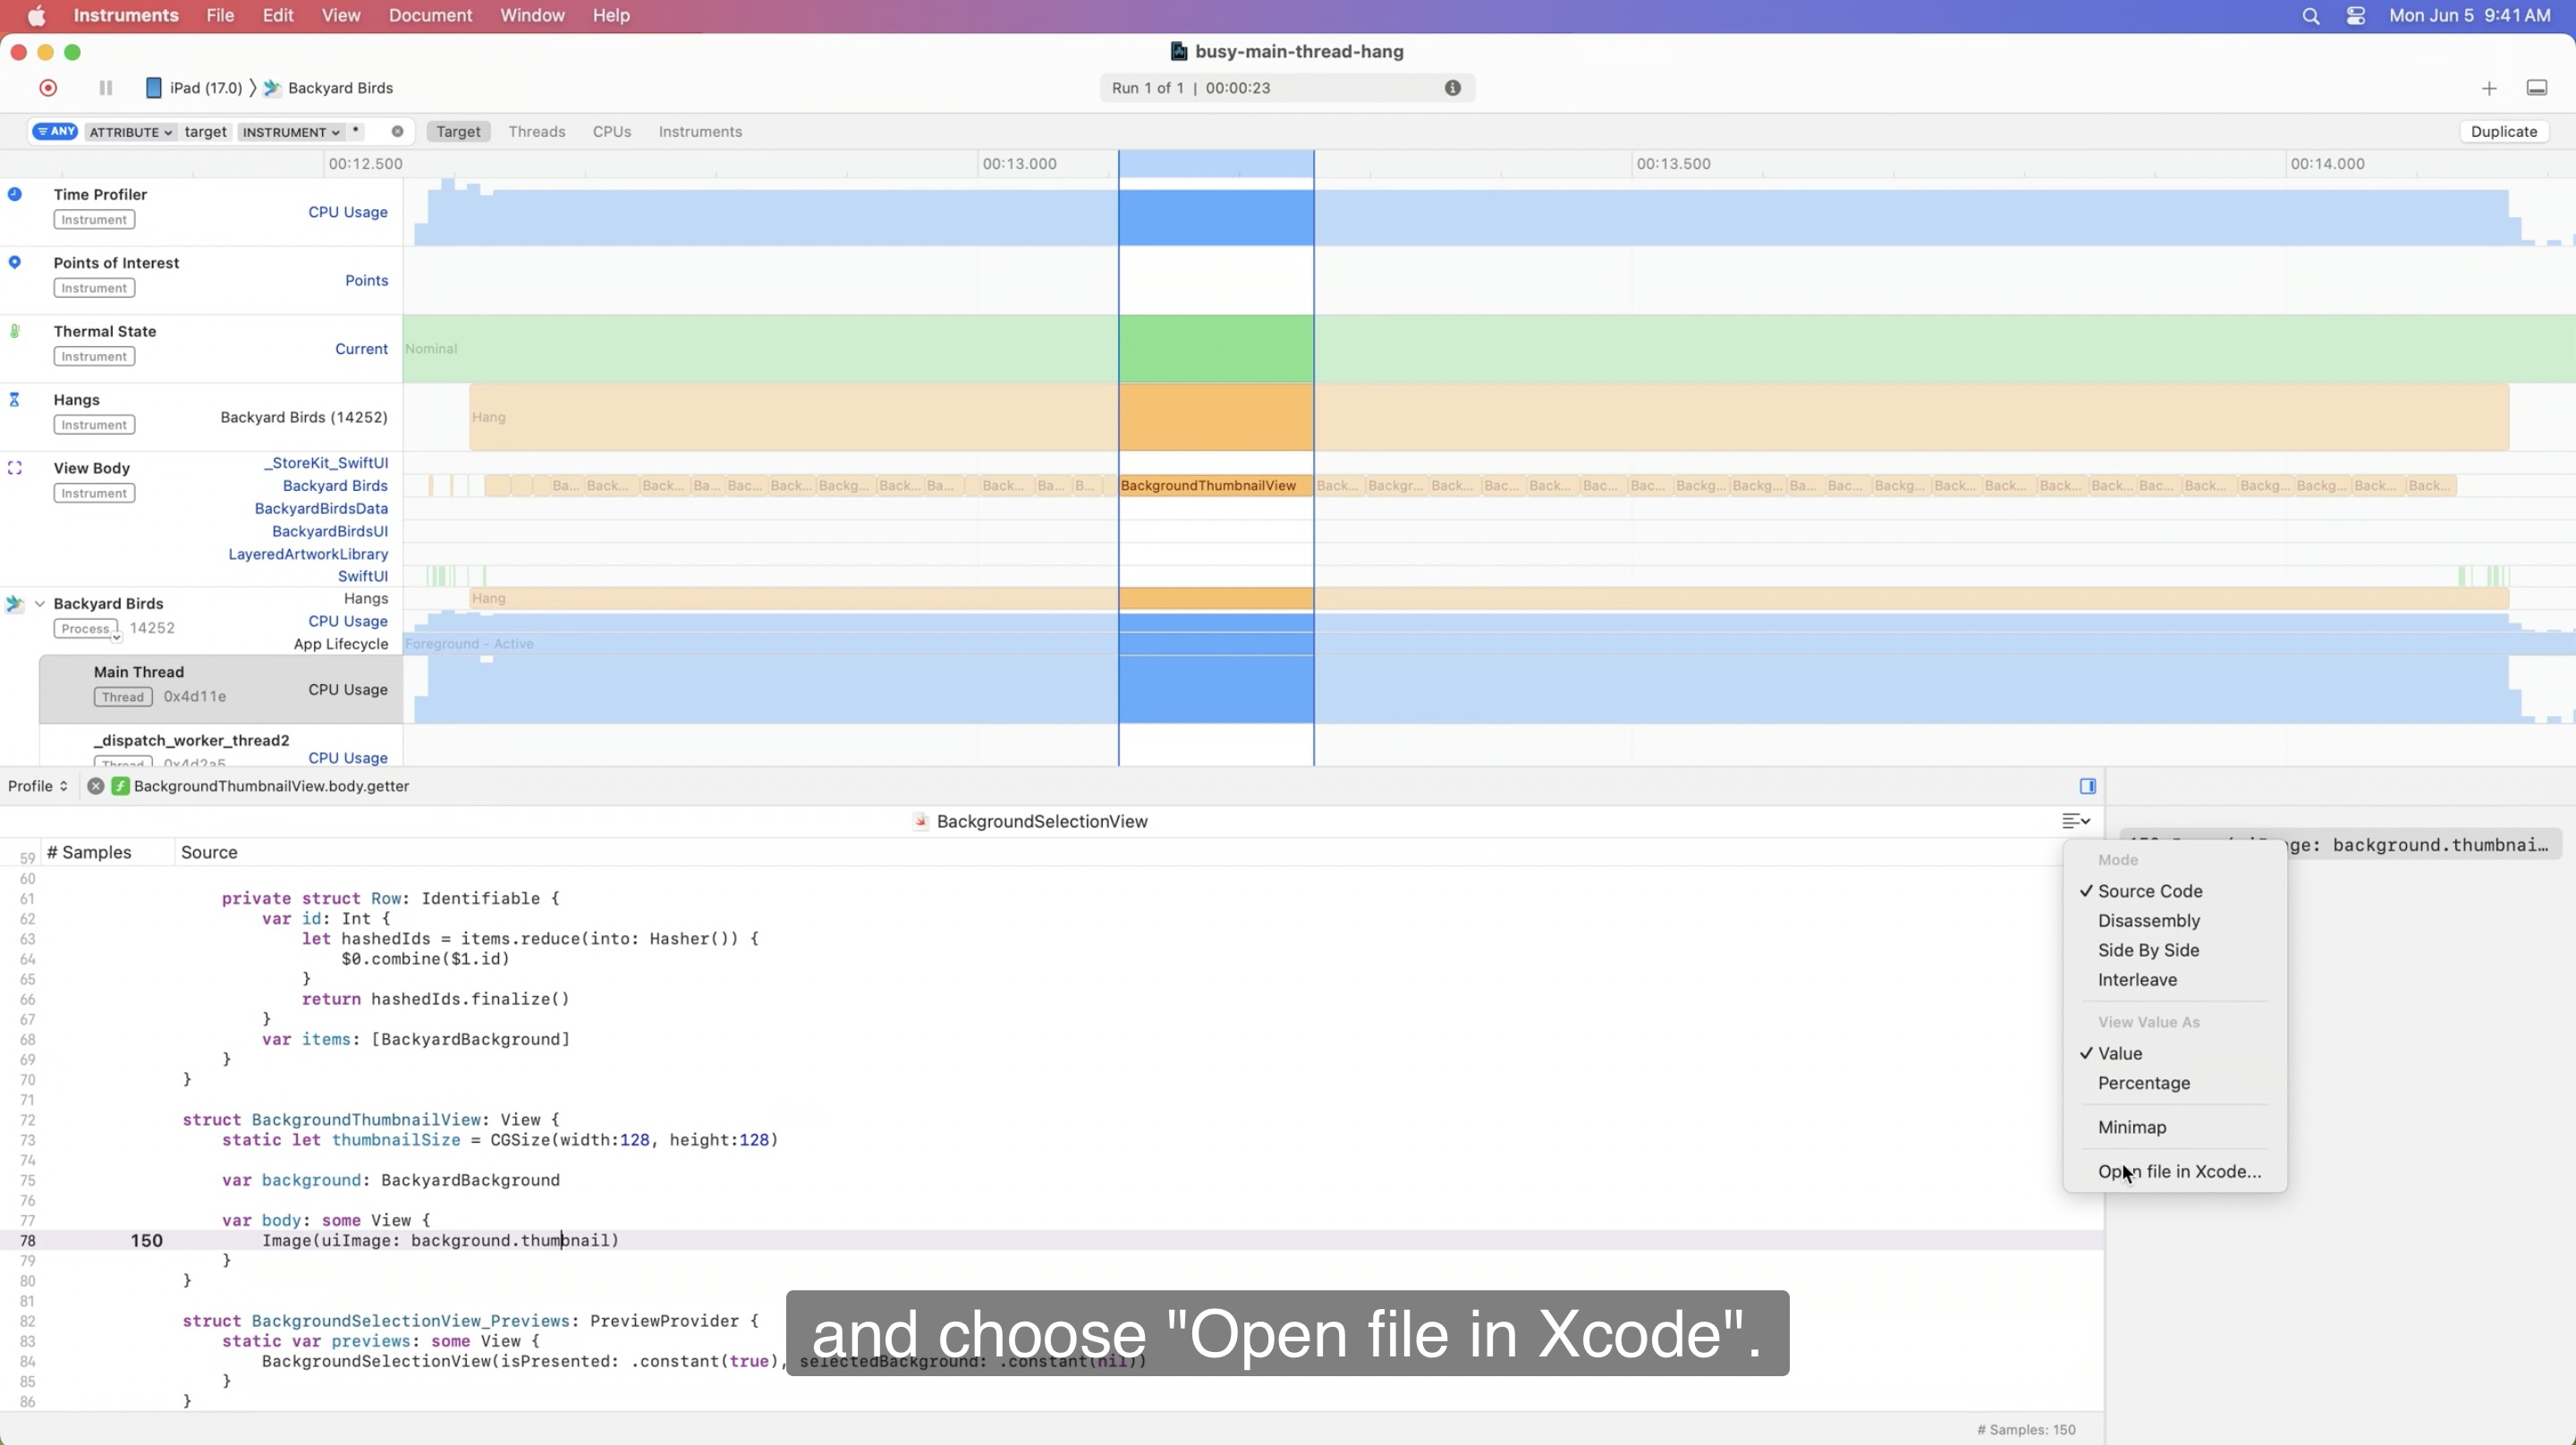
In order to identify the hang, first select the Backyard Birds on the left panel, tap the disclosure indicator to unfold all the threads, select main thread, then click to the ugly red area (hang-interval in the timeline) to show the context menu, hold option key and click “Set inspection range and zoom” (as shown in the above screenshot).
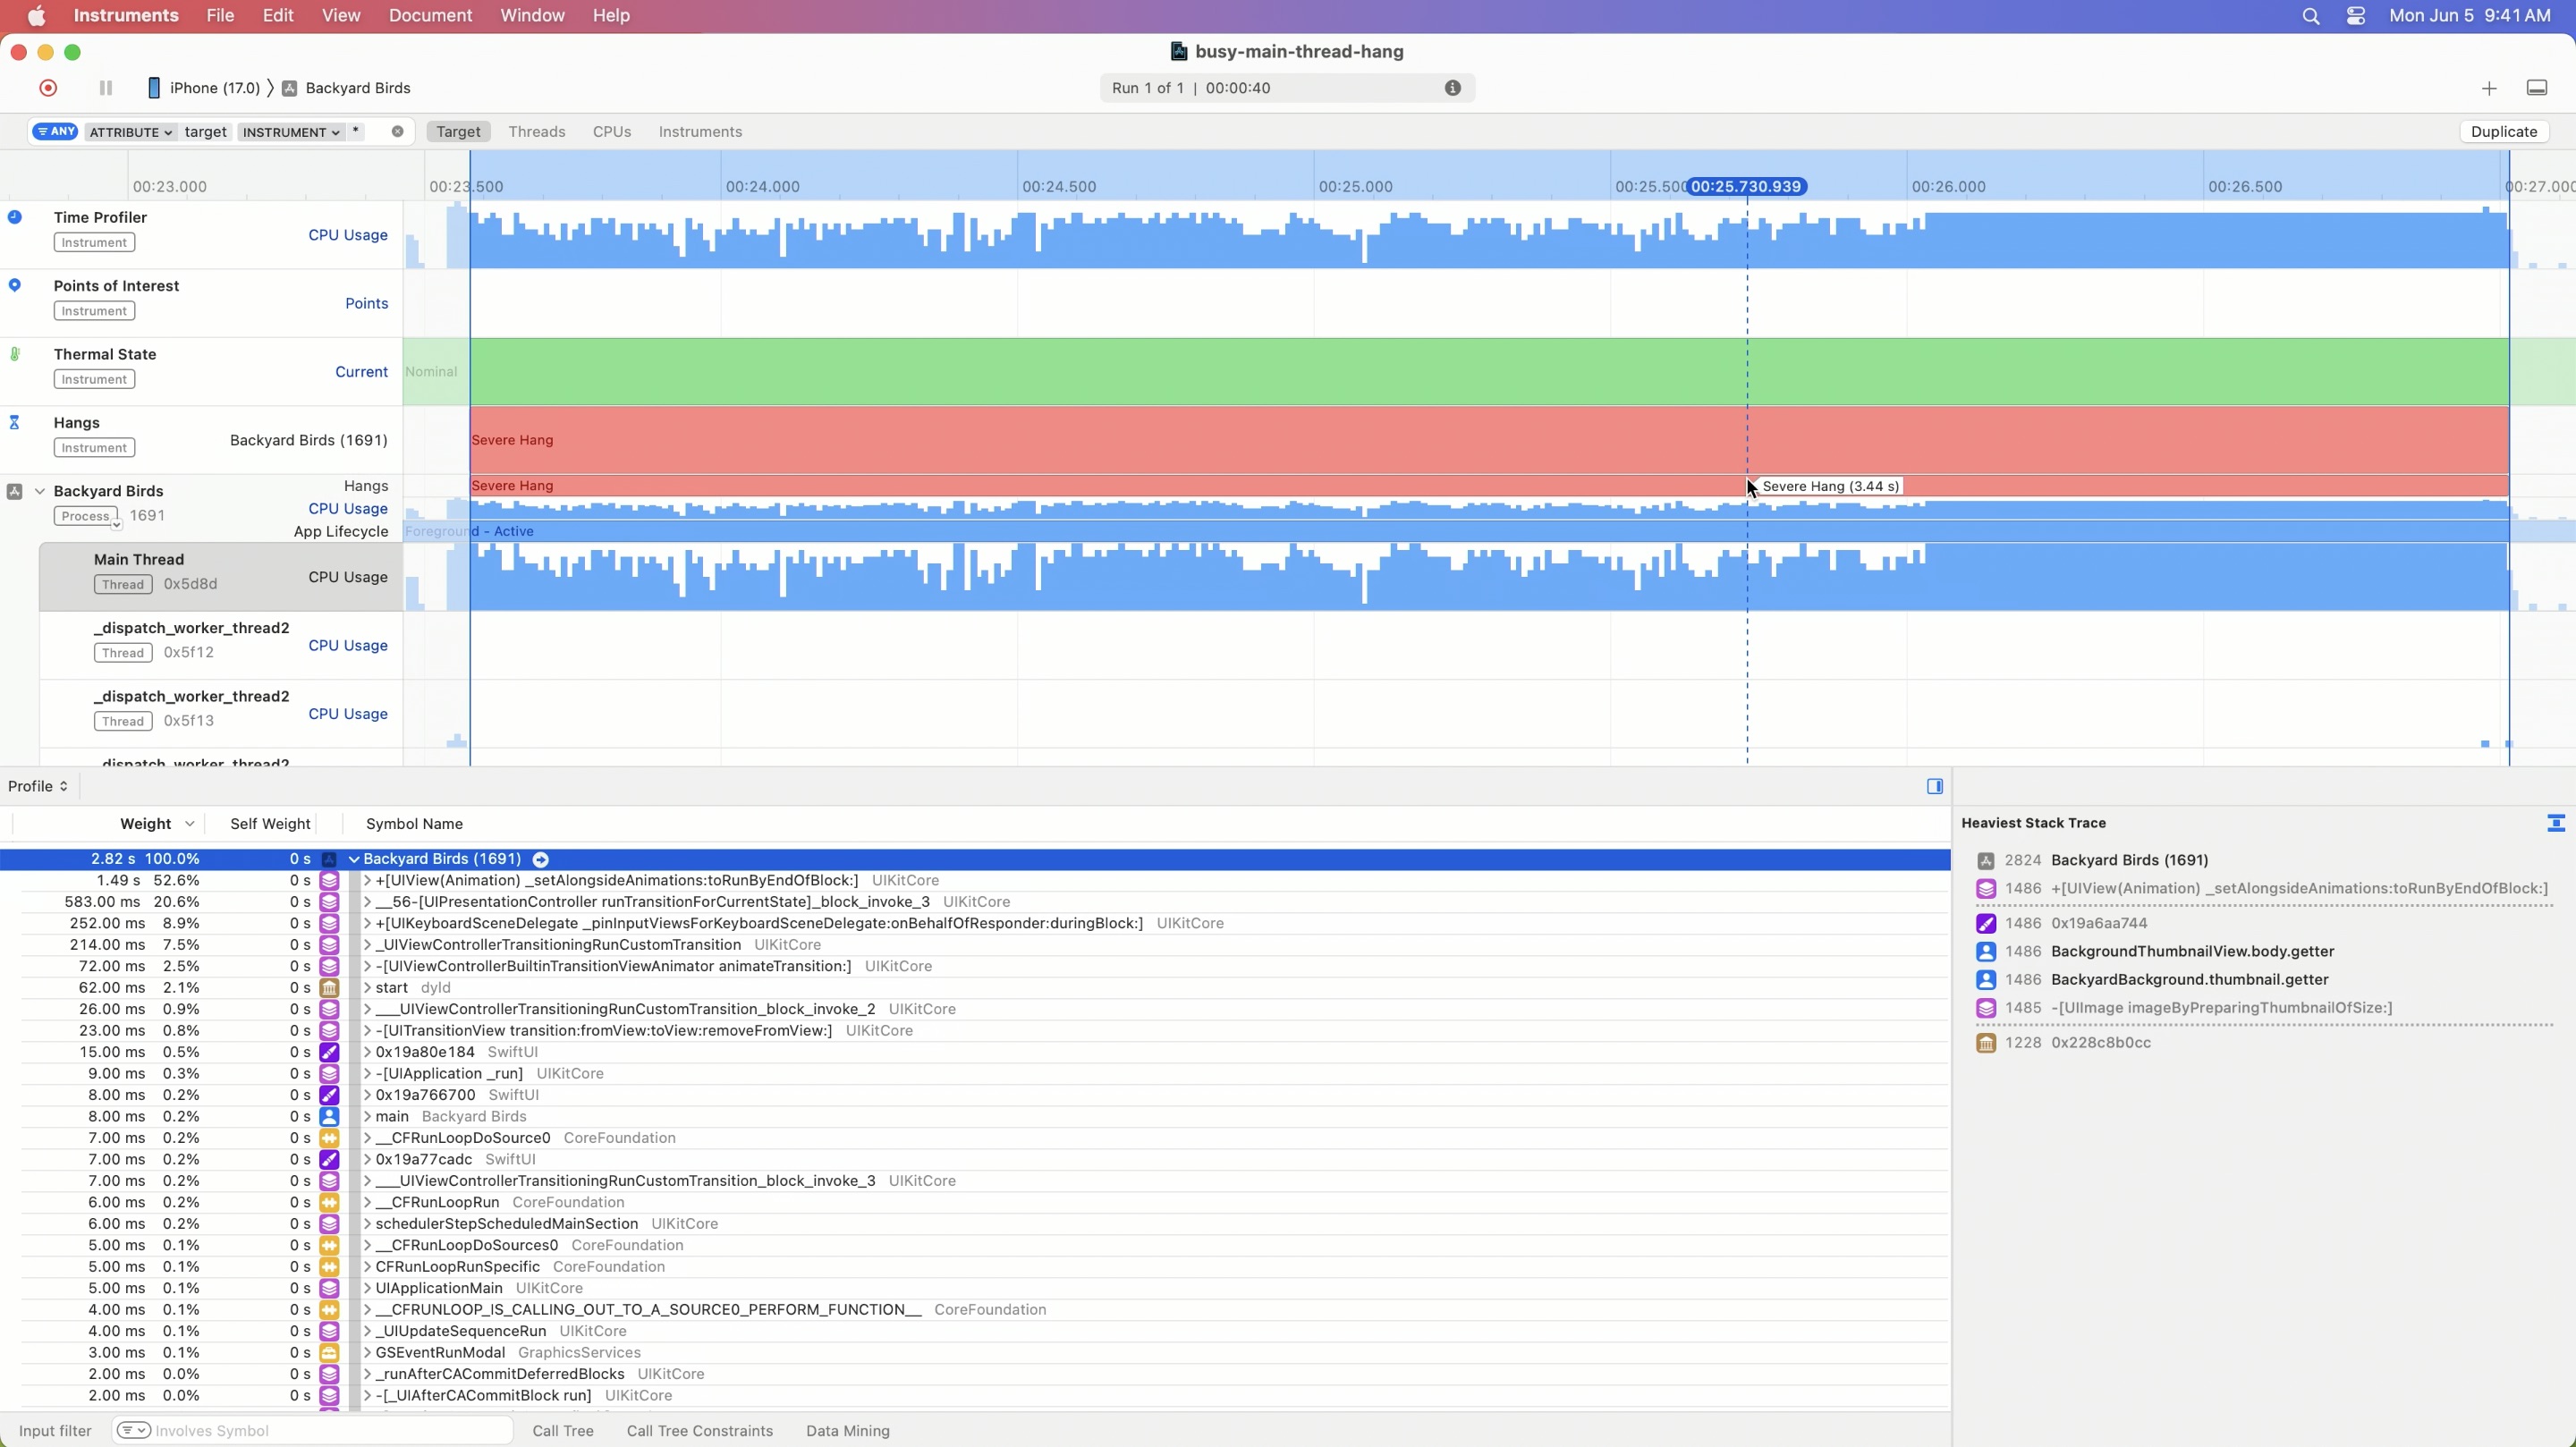
This zooms into the interval’s range and filters the data displayed in the detail view to the selected time range.
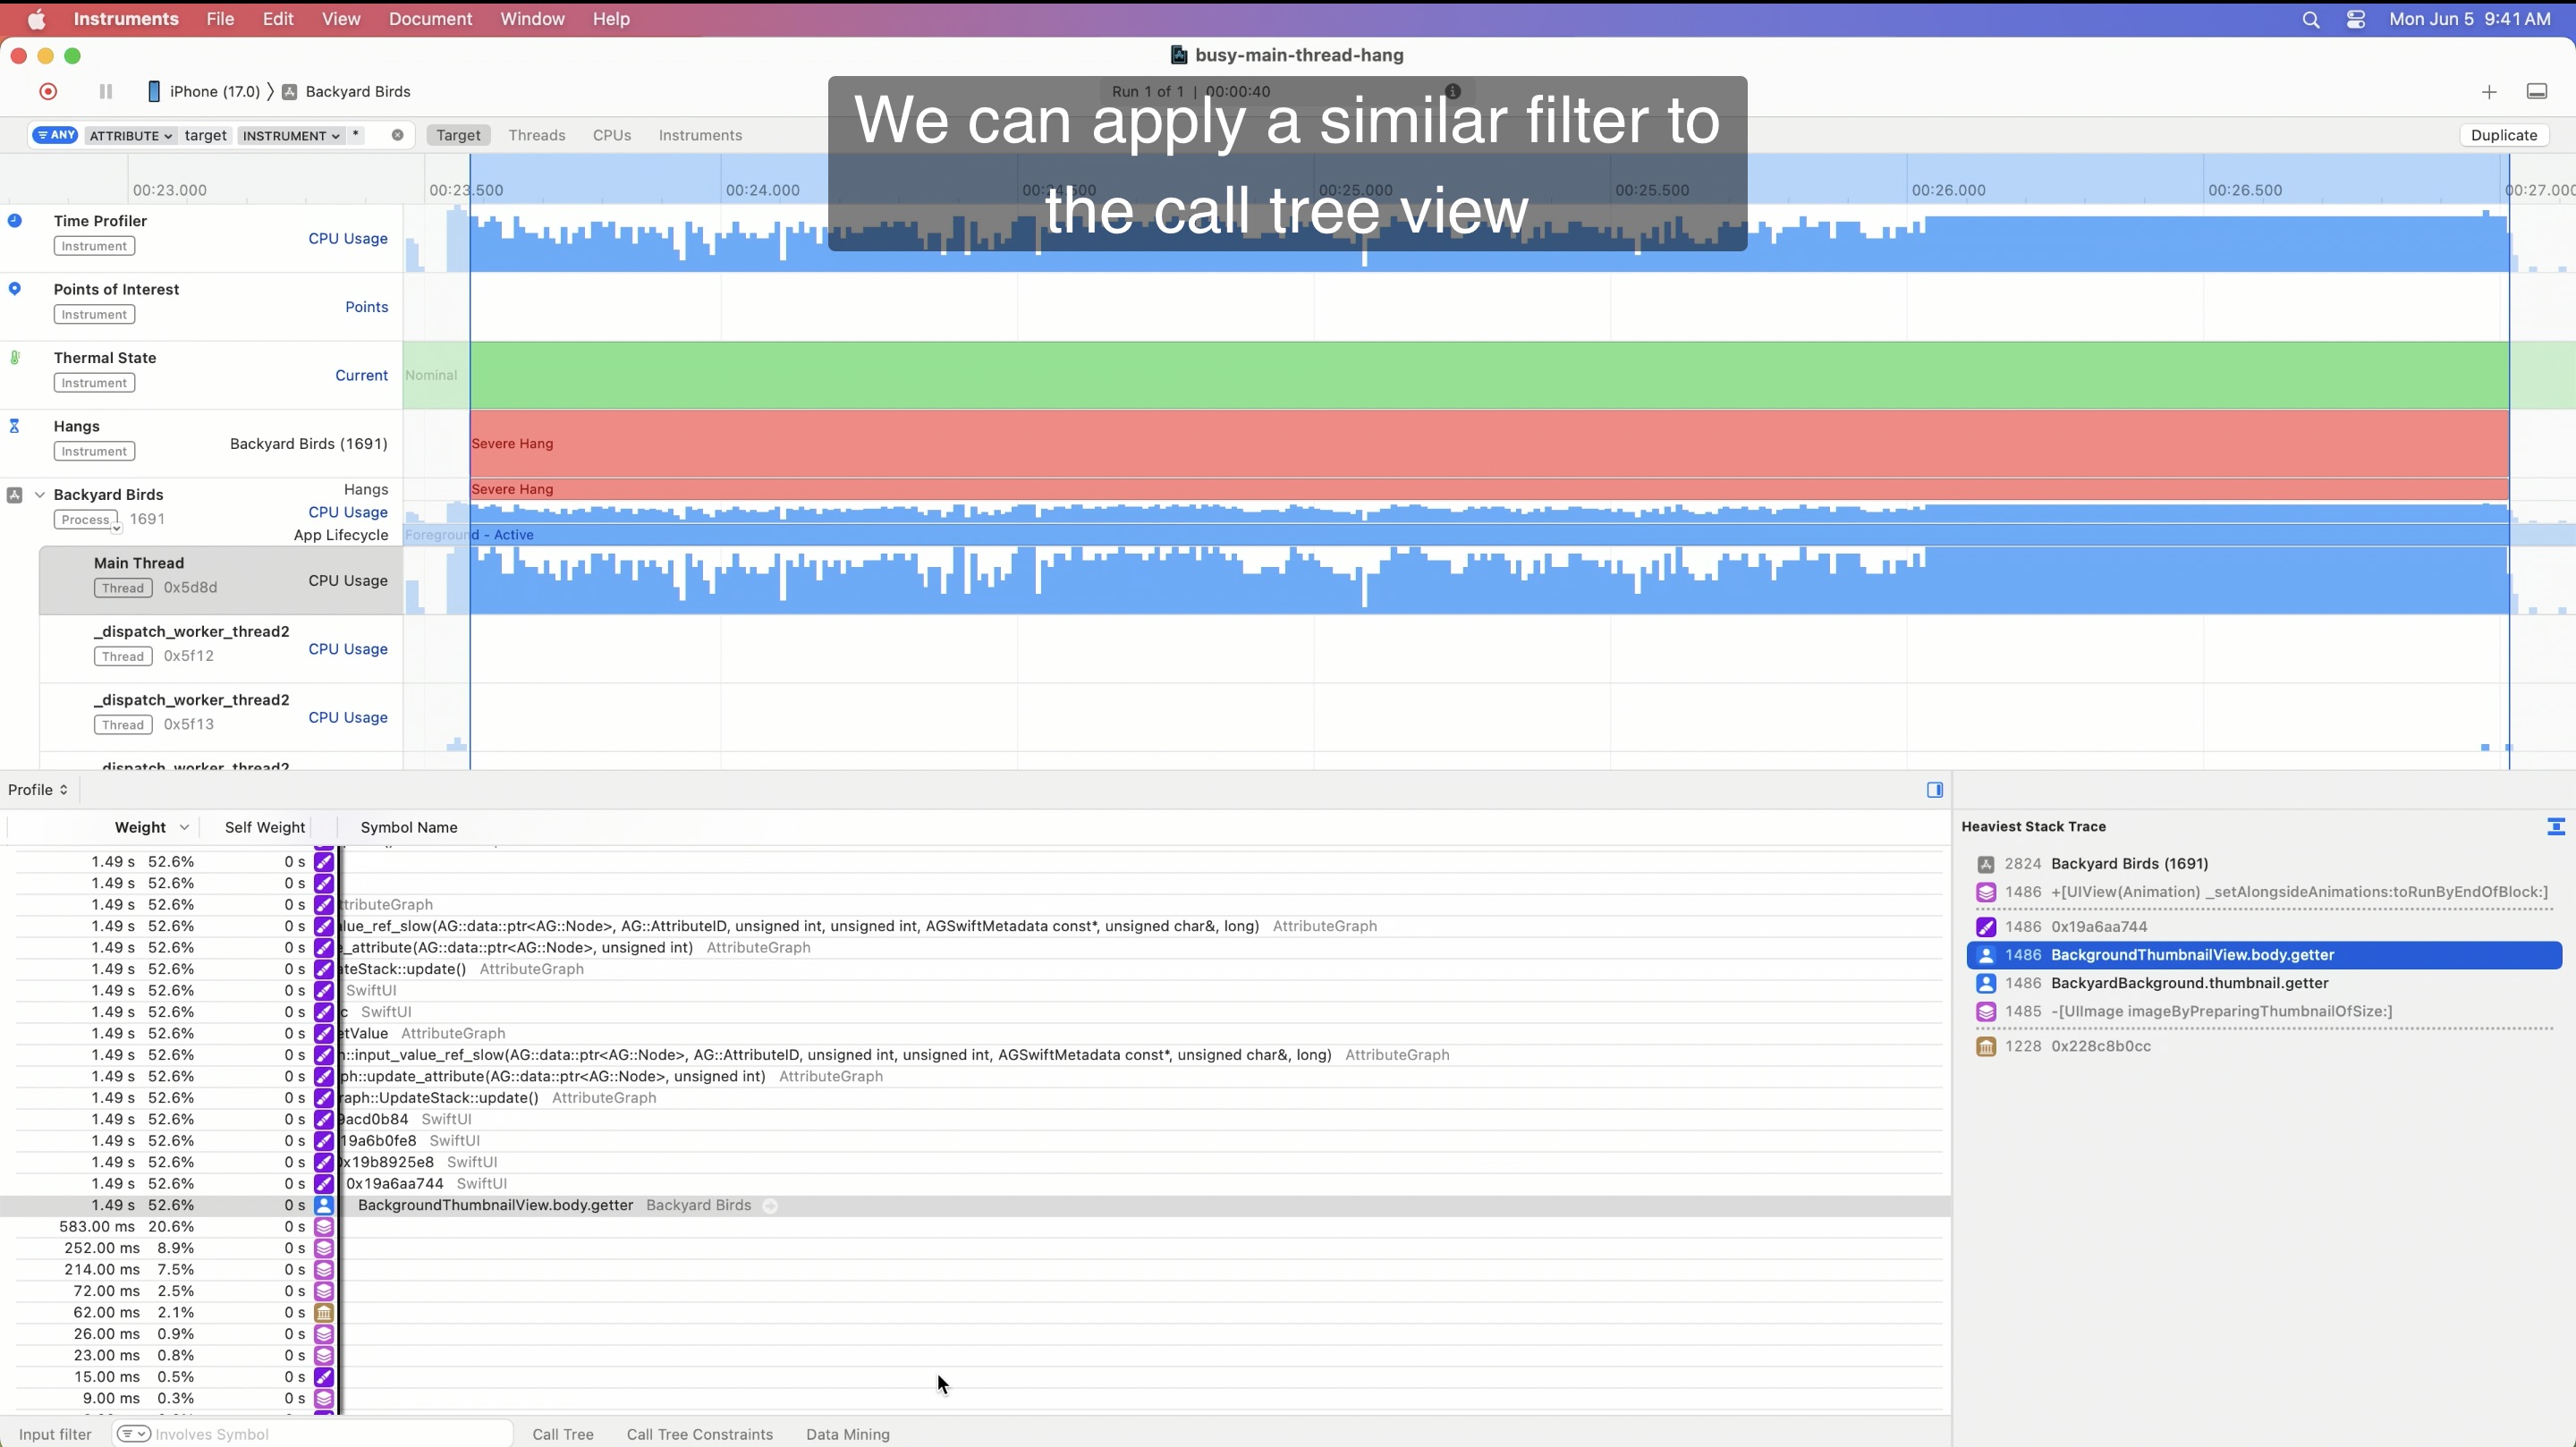
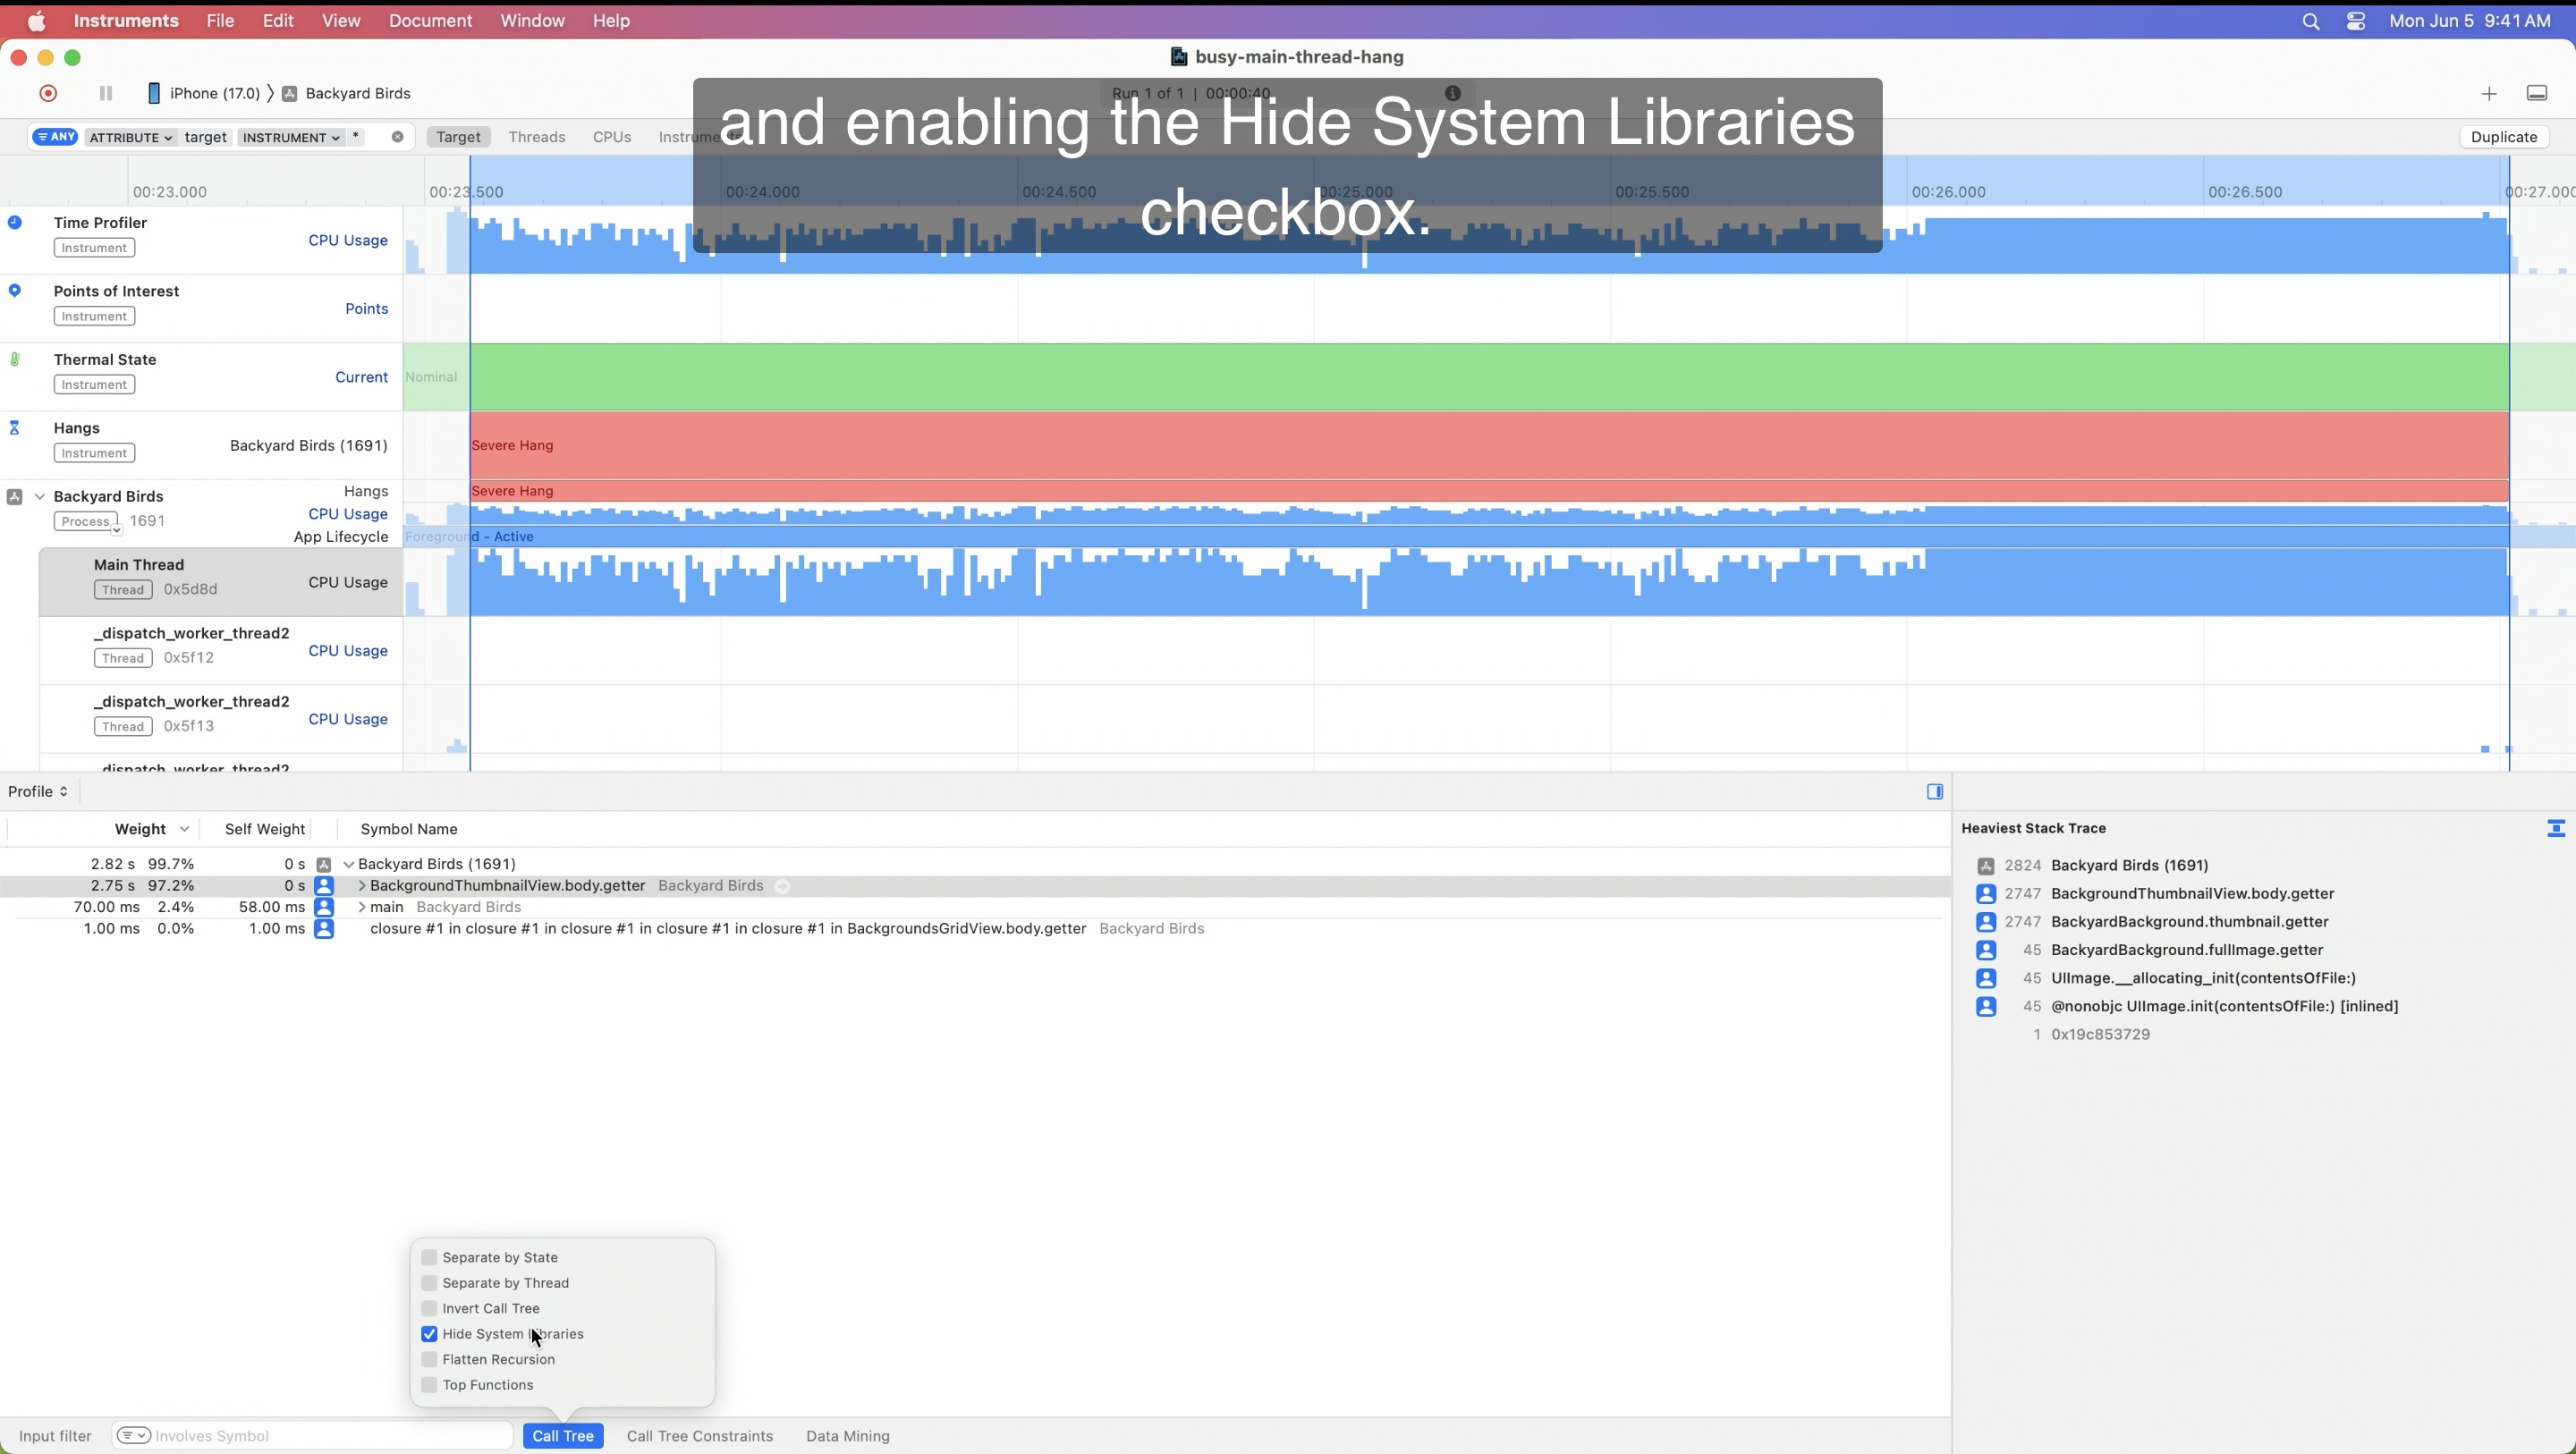
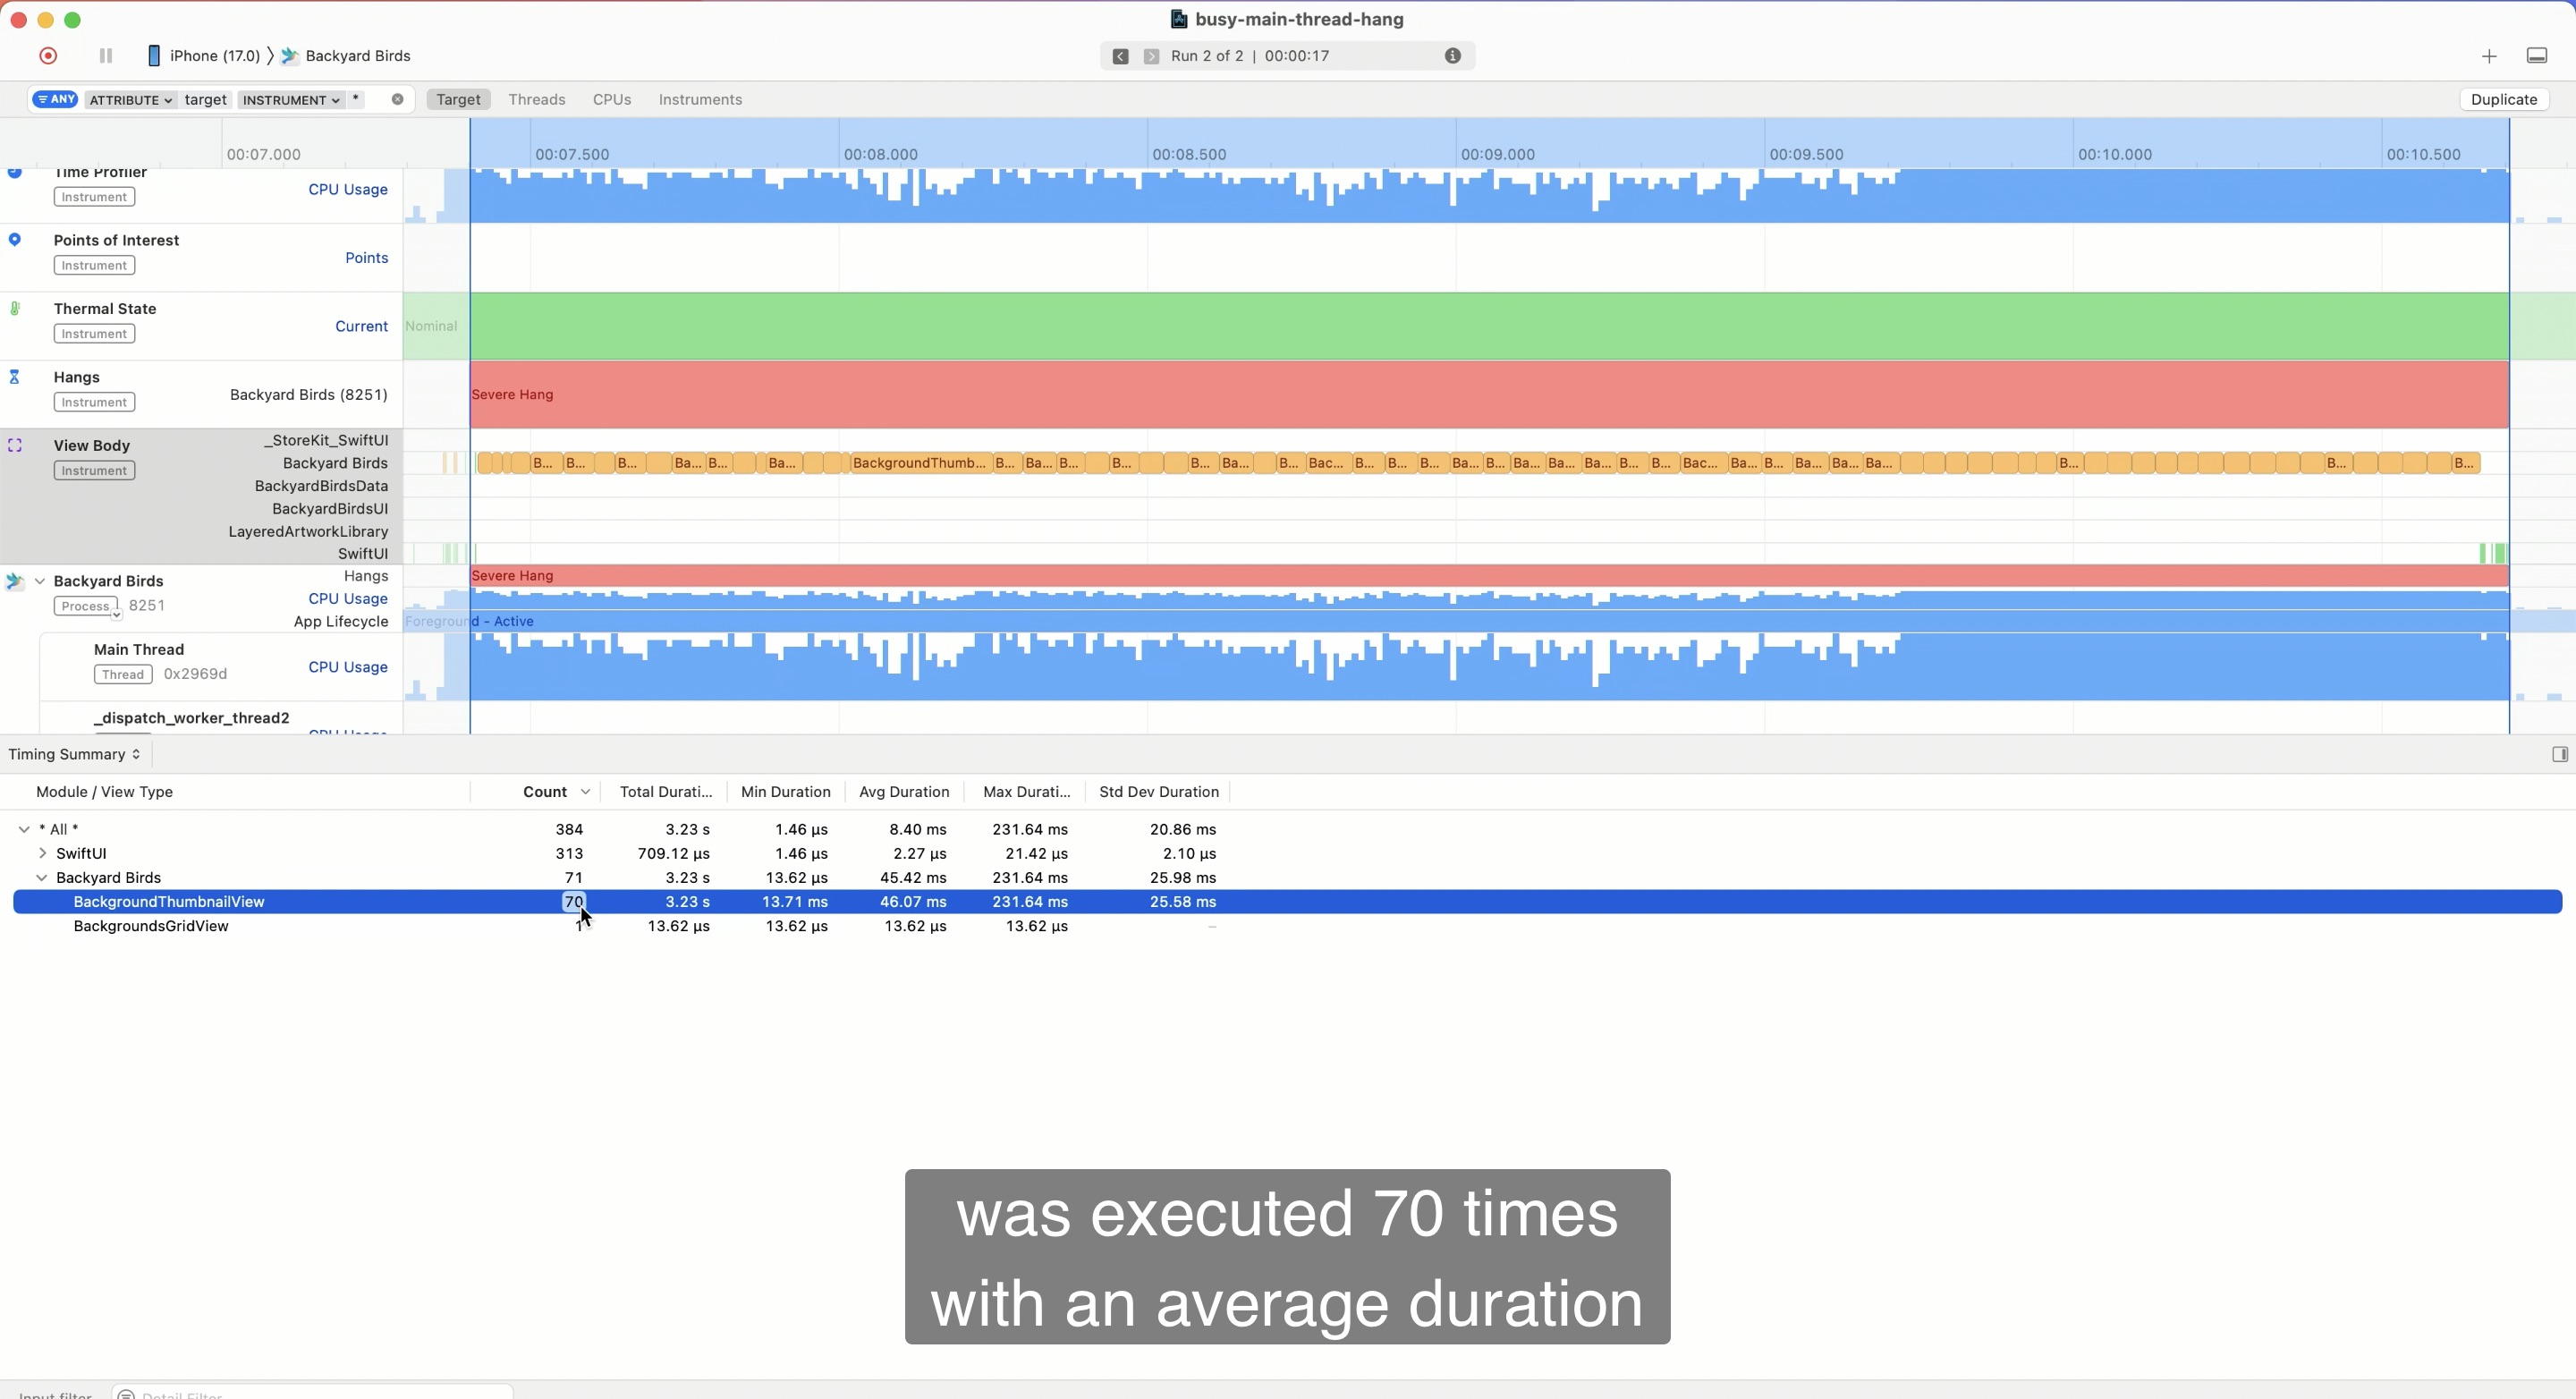
After you have done above two steps, it will filter out all functions from the system libraries, making it a lot easier for you to inspect just on your hanging code.
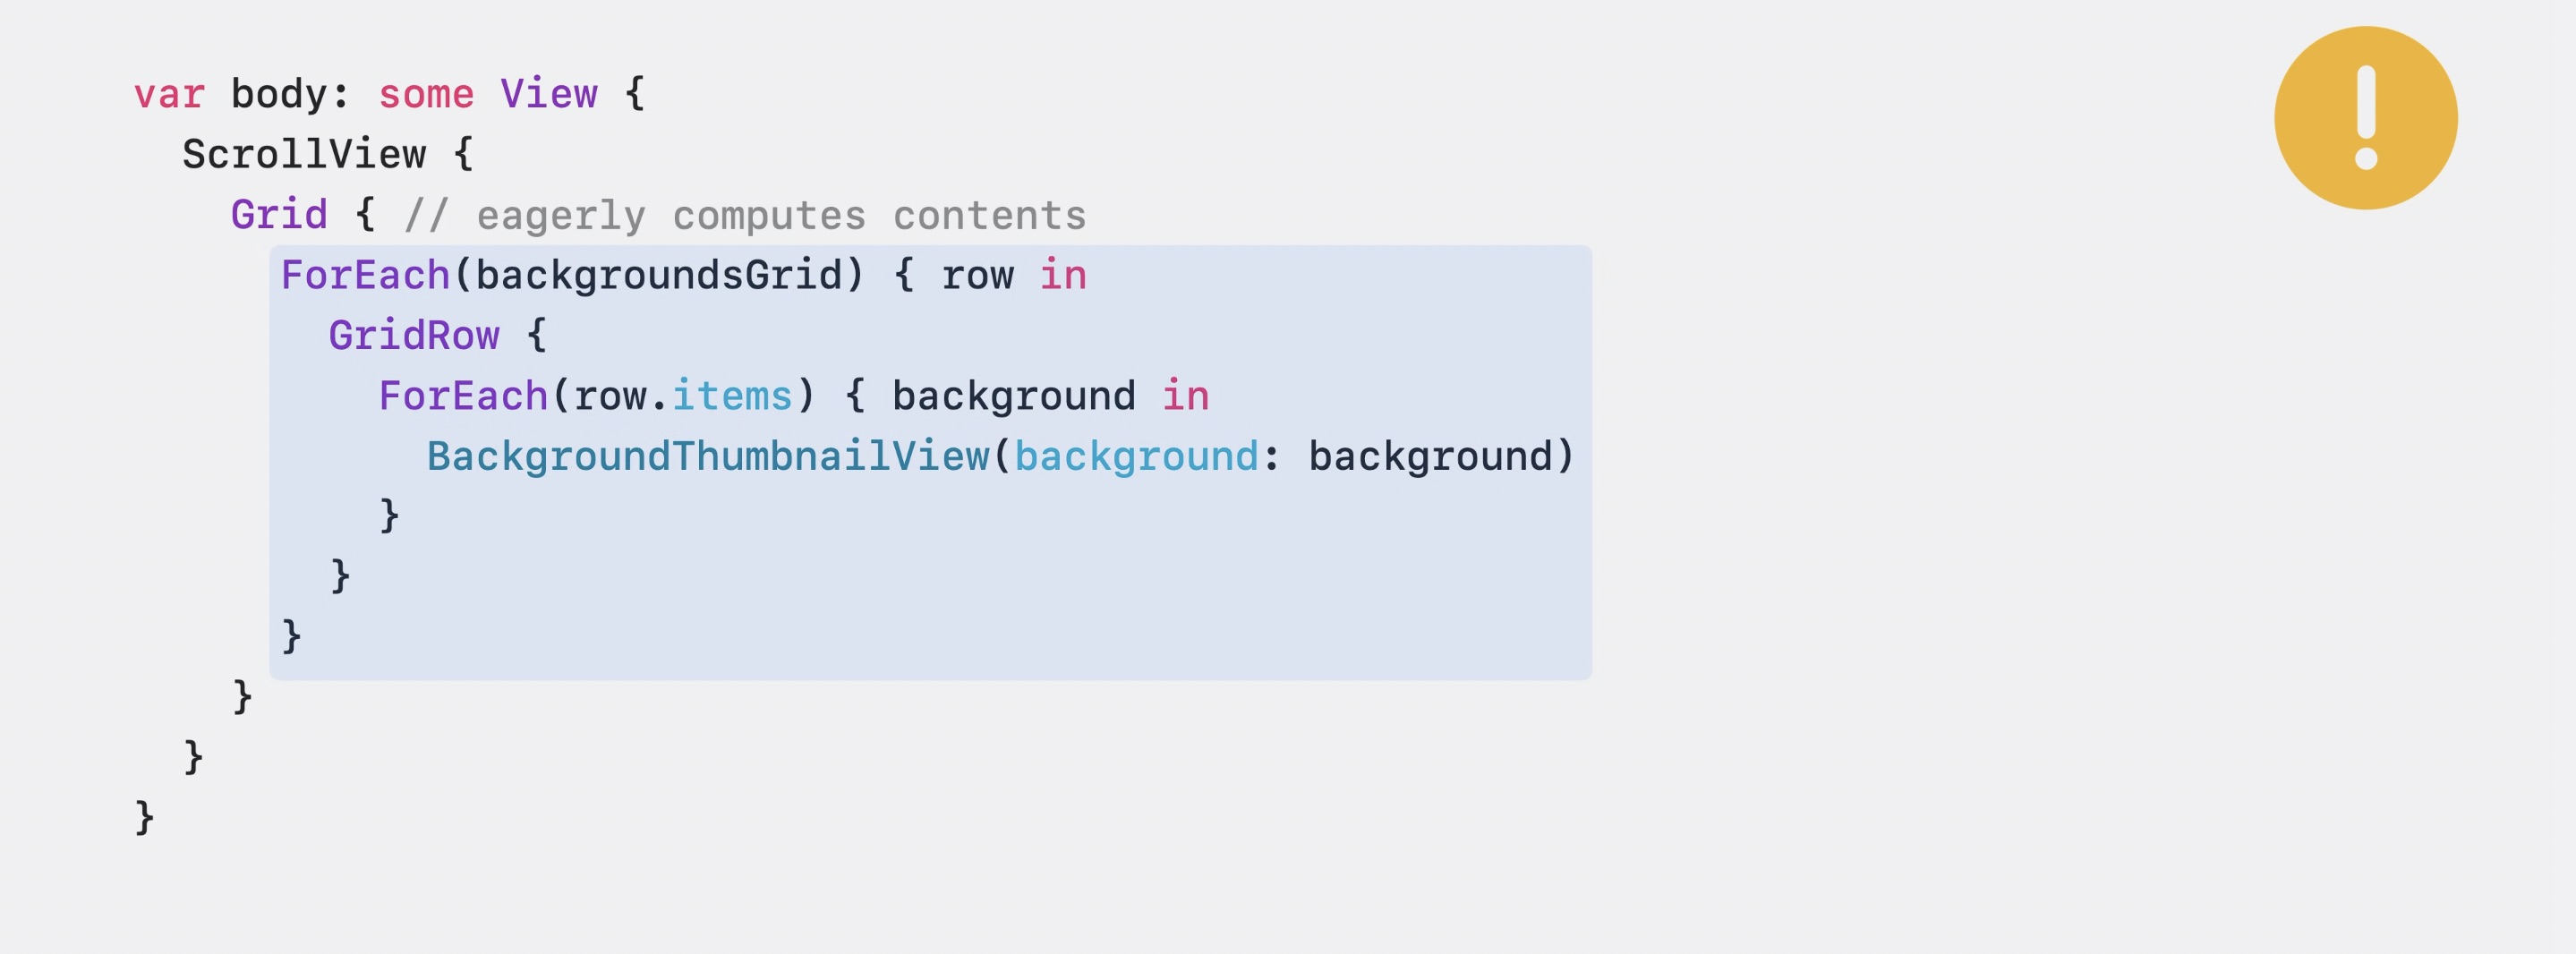
As you can see, the BackgroundThumbnailView.body.getter takes the longest. It is the Busy Main Thread problem. There are two potential scenarios to cause this hang.
How we should reduce the work on the main thread depends on which case we have.
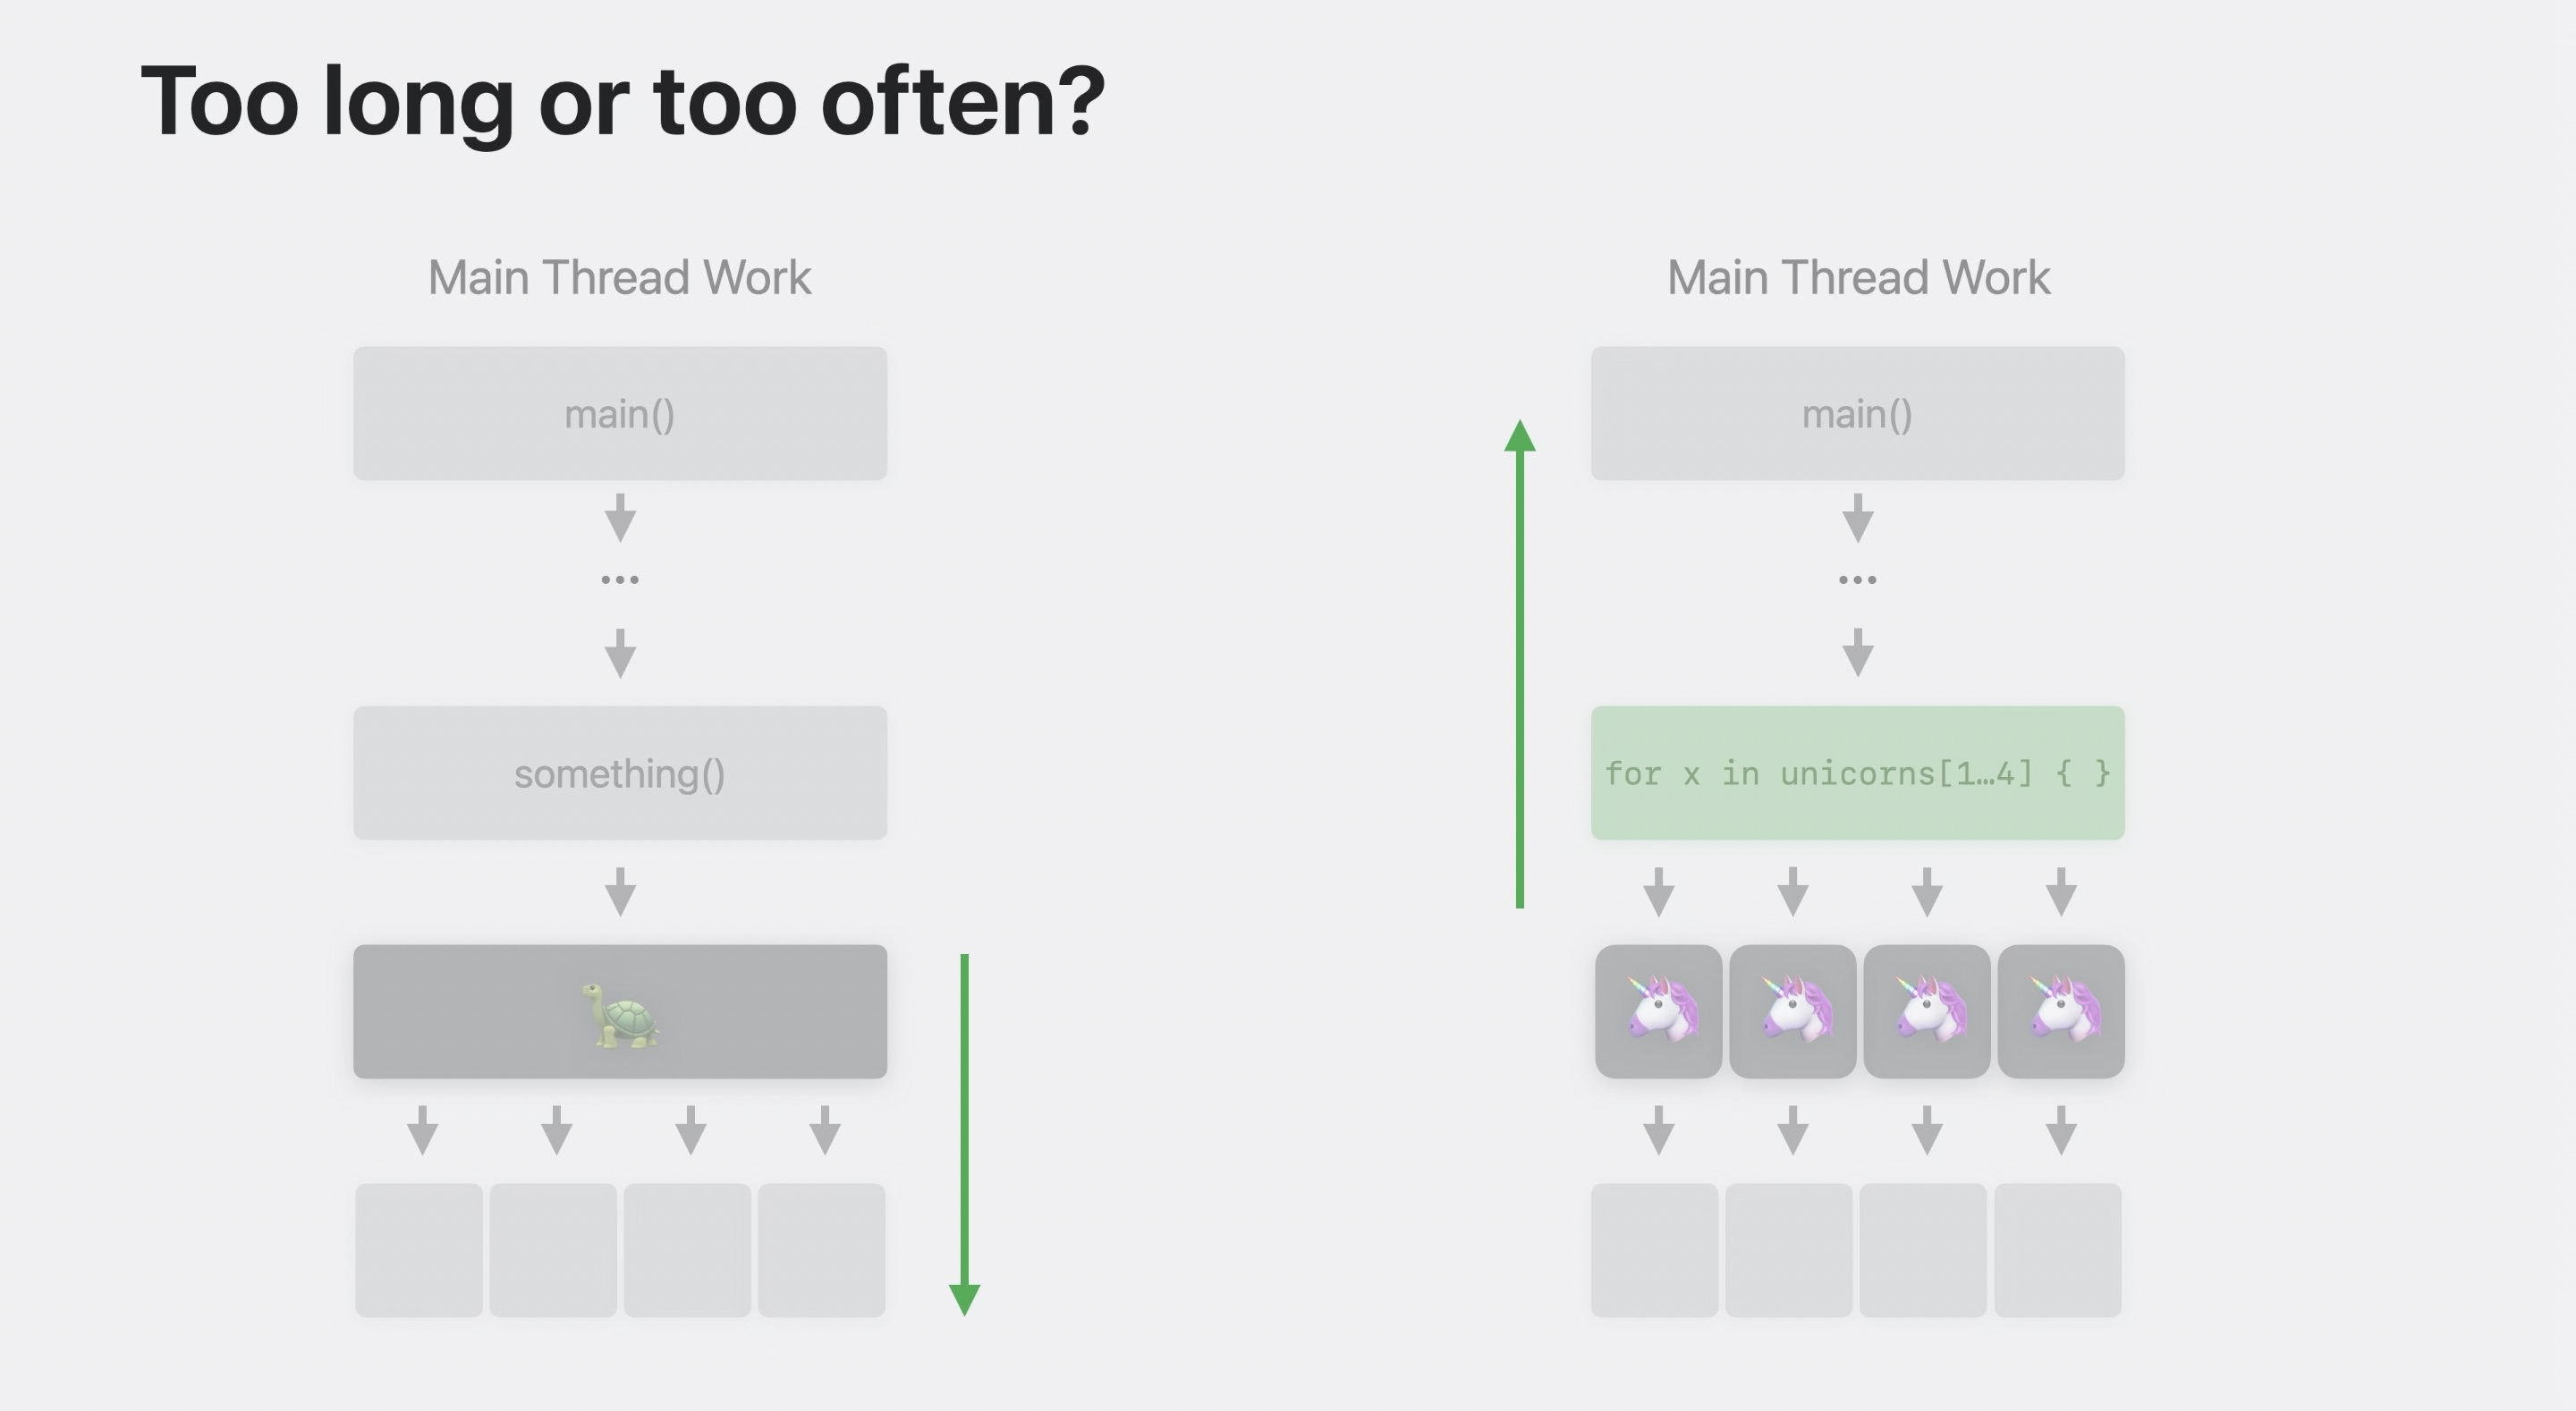
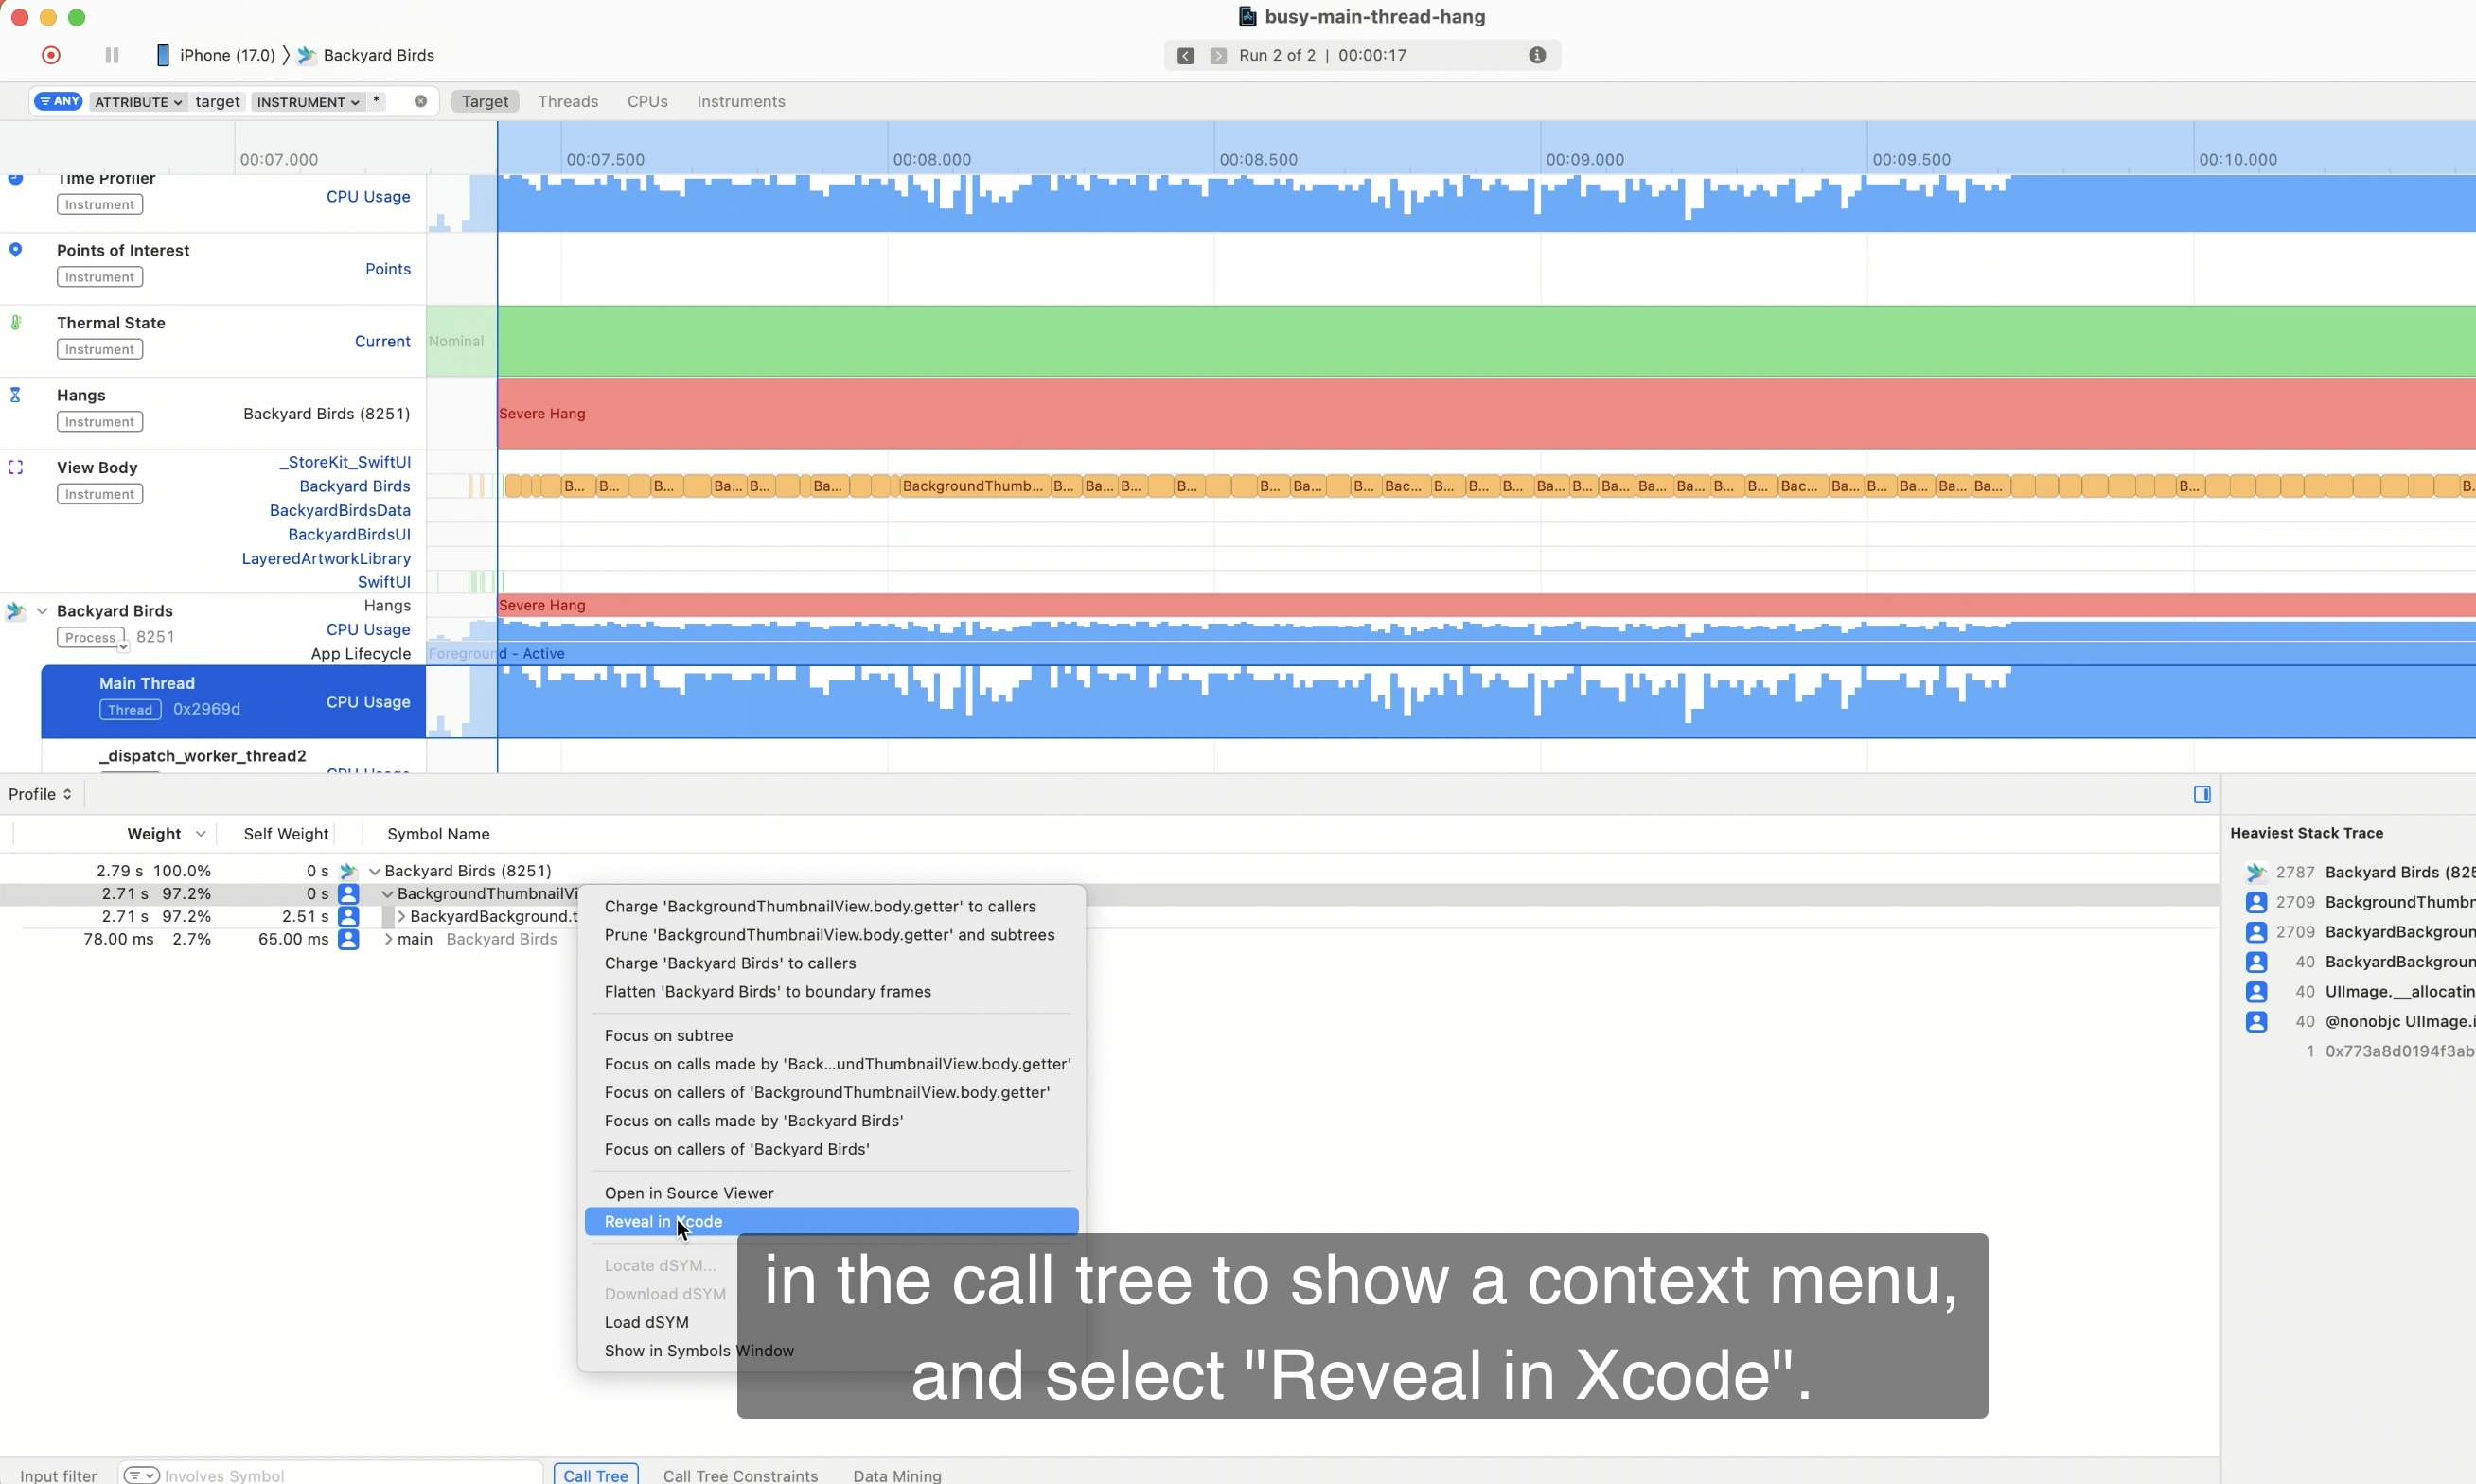
For a long running function, we want to look at its implementation and its callees. We need to look further down.
If a function is called a lot of times, it is more beneficial to look at what is calling it and determine whether we can do so less often. We need to look further up.
Bad news is time profiler cannot tell us which case we have. Time profiler gathers data by checking what’s running on the CPU in regular intervals. And for each sample, it checks which function is currently running on the CPU.
To measure the executing time of a specific function, use os_signposts. Let’s add SwiftUI View Body instruments to see what’s going on in our SwiftUI View.
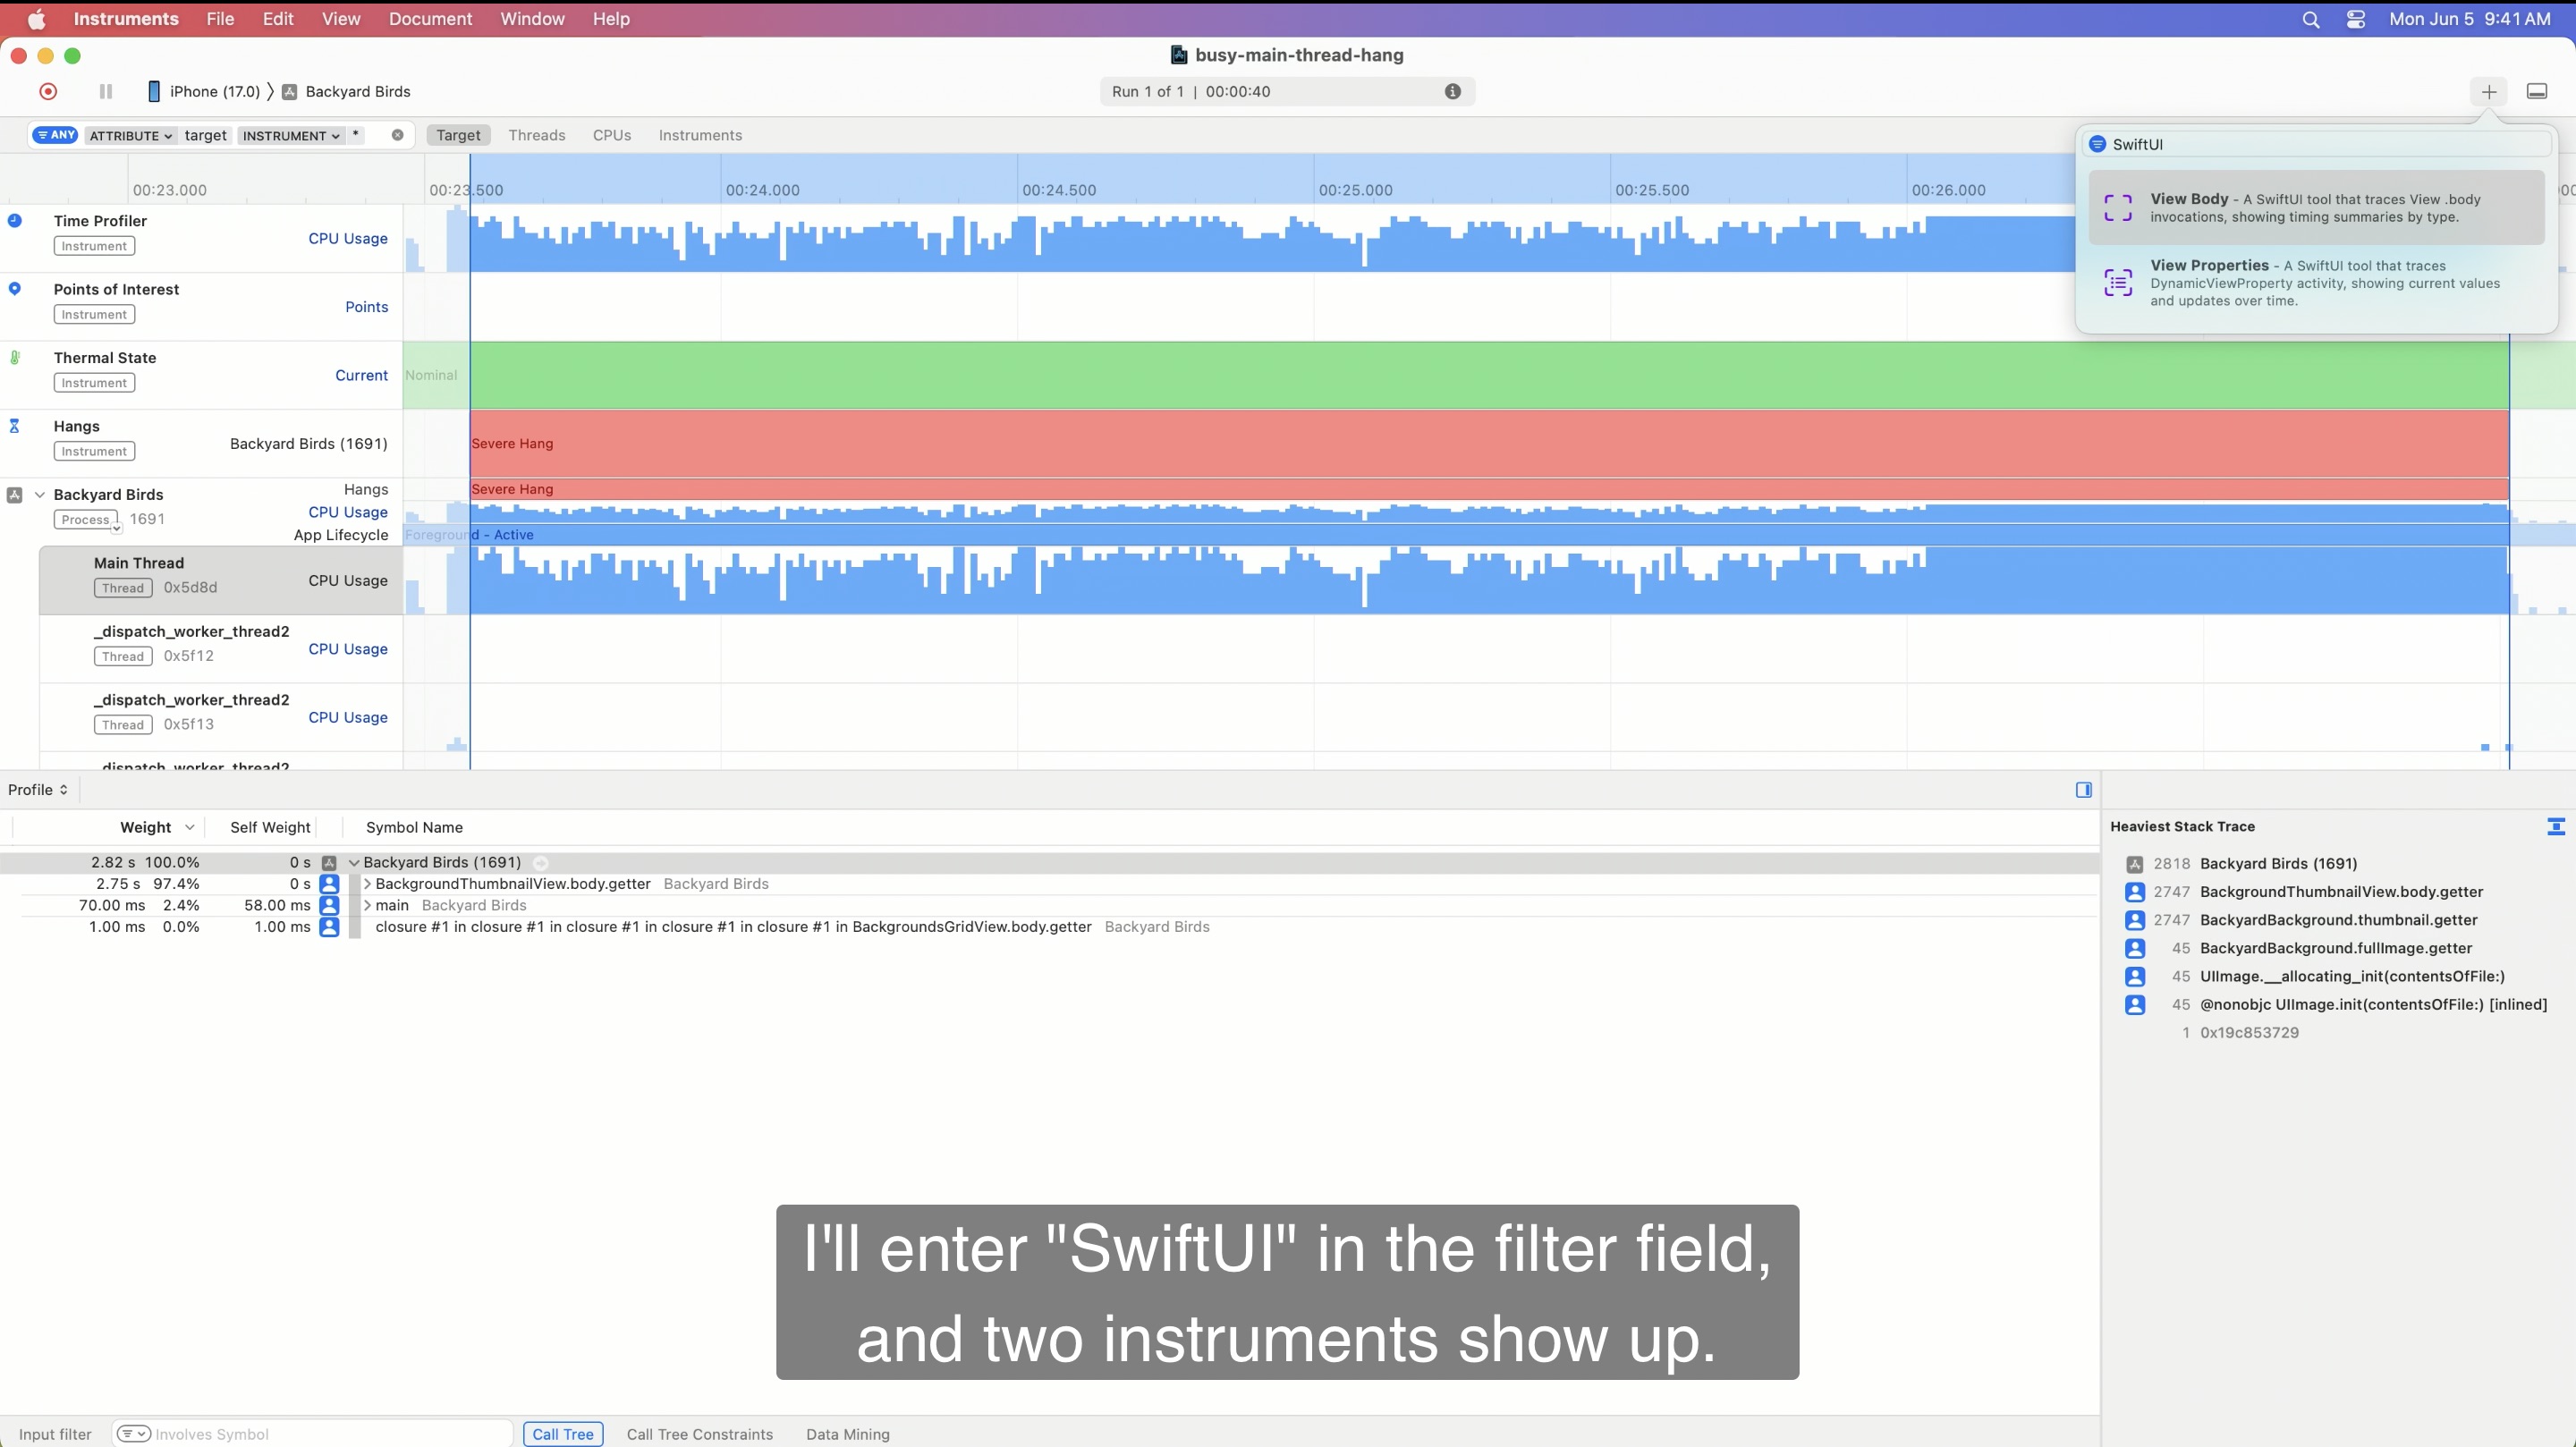
Click the view body instrument and drag it into the document window to add it. We gotta record again.
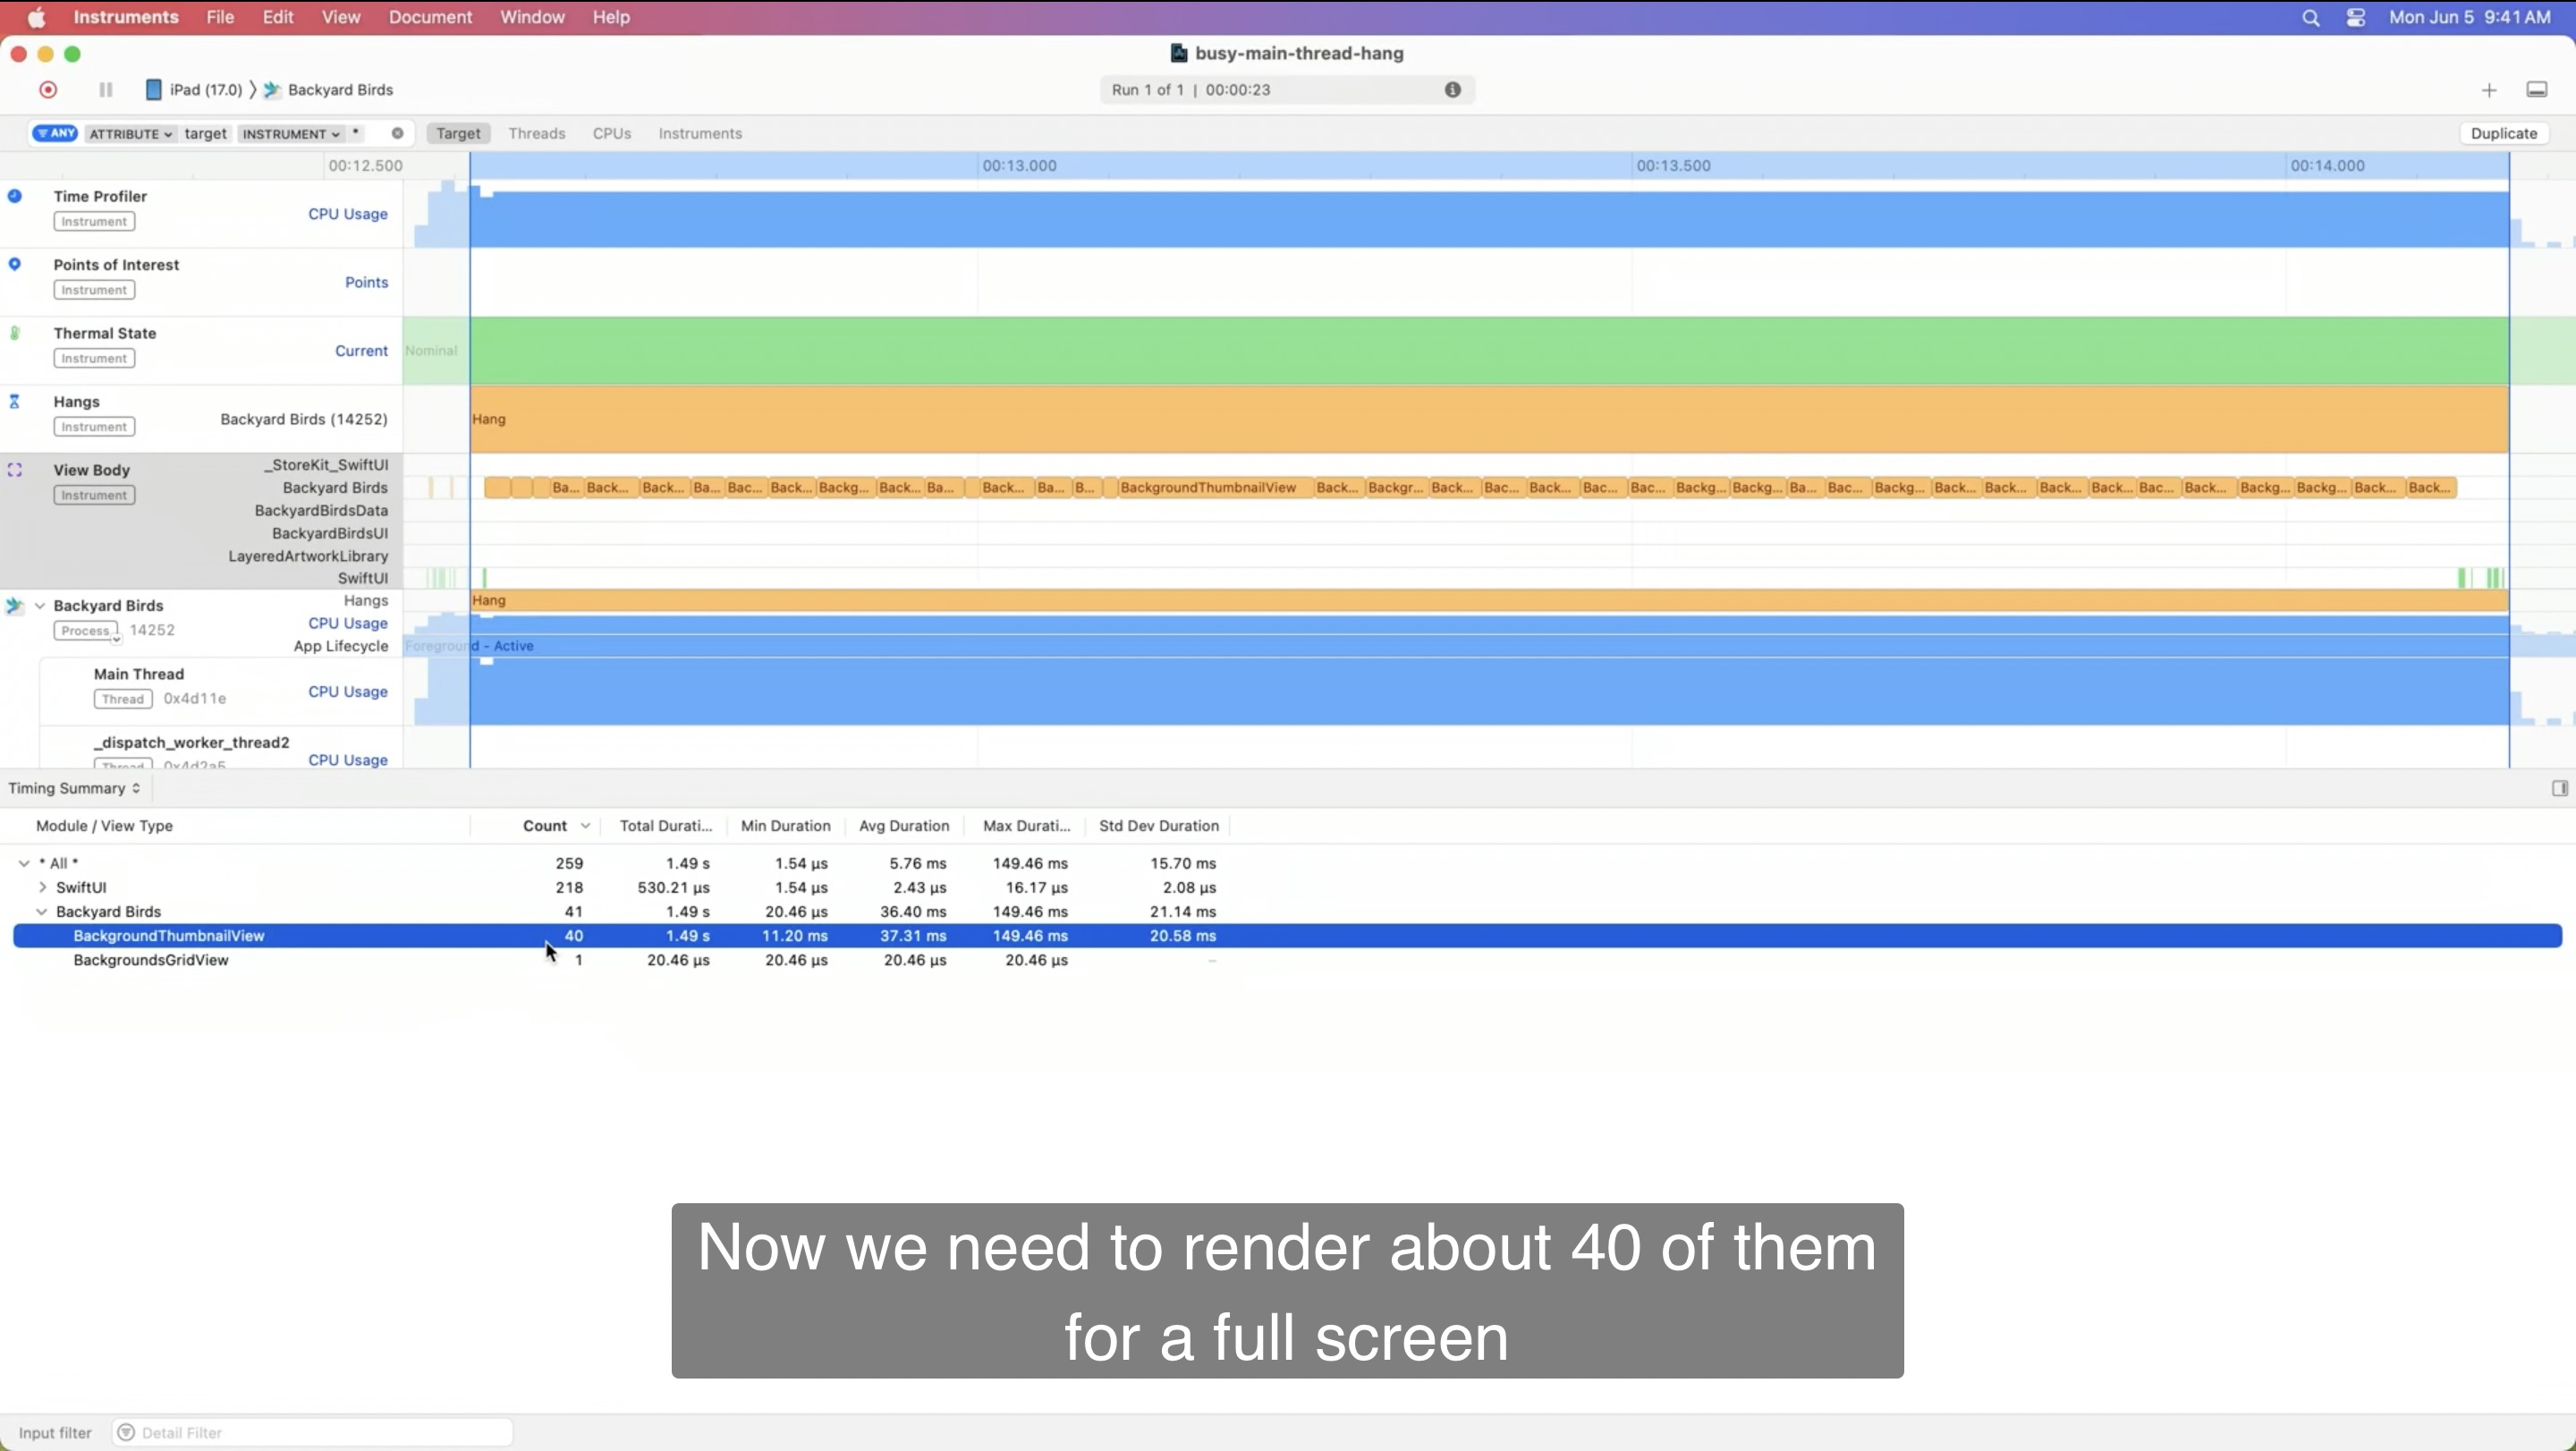
You can see a lot of orange intervals all labelled BackgroundThumbnailView. This tells us precisely how many body executions there were and how long each one took. The orange color indicates that the runtime of that specific body execution took a little longer than what we are aiming for with SwiftUI. The bigger problem is how many intervals there are.
We can now address to that problematic code.
Let’s just use lazy VGrid to solve the issue.
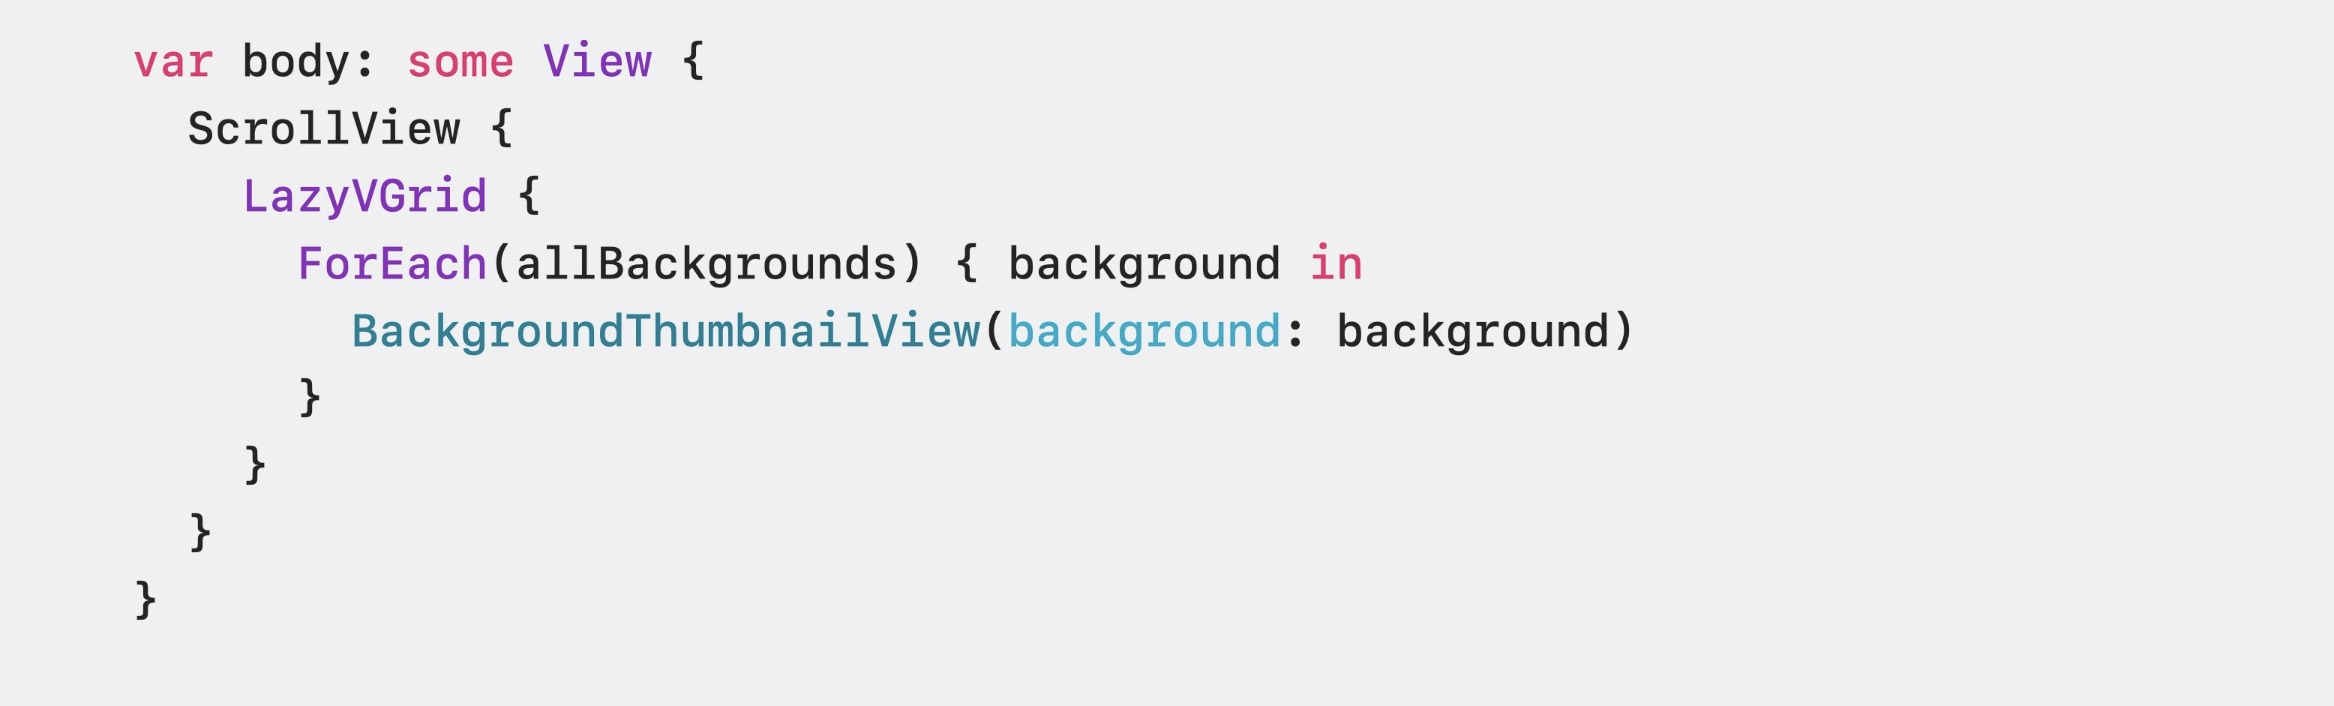
Let’s profile the updated code.
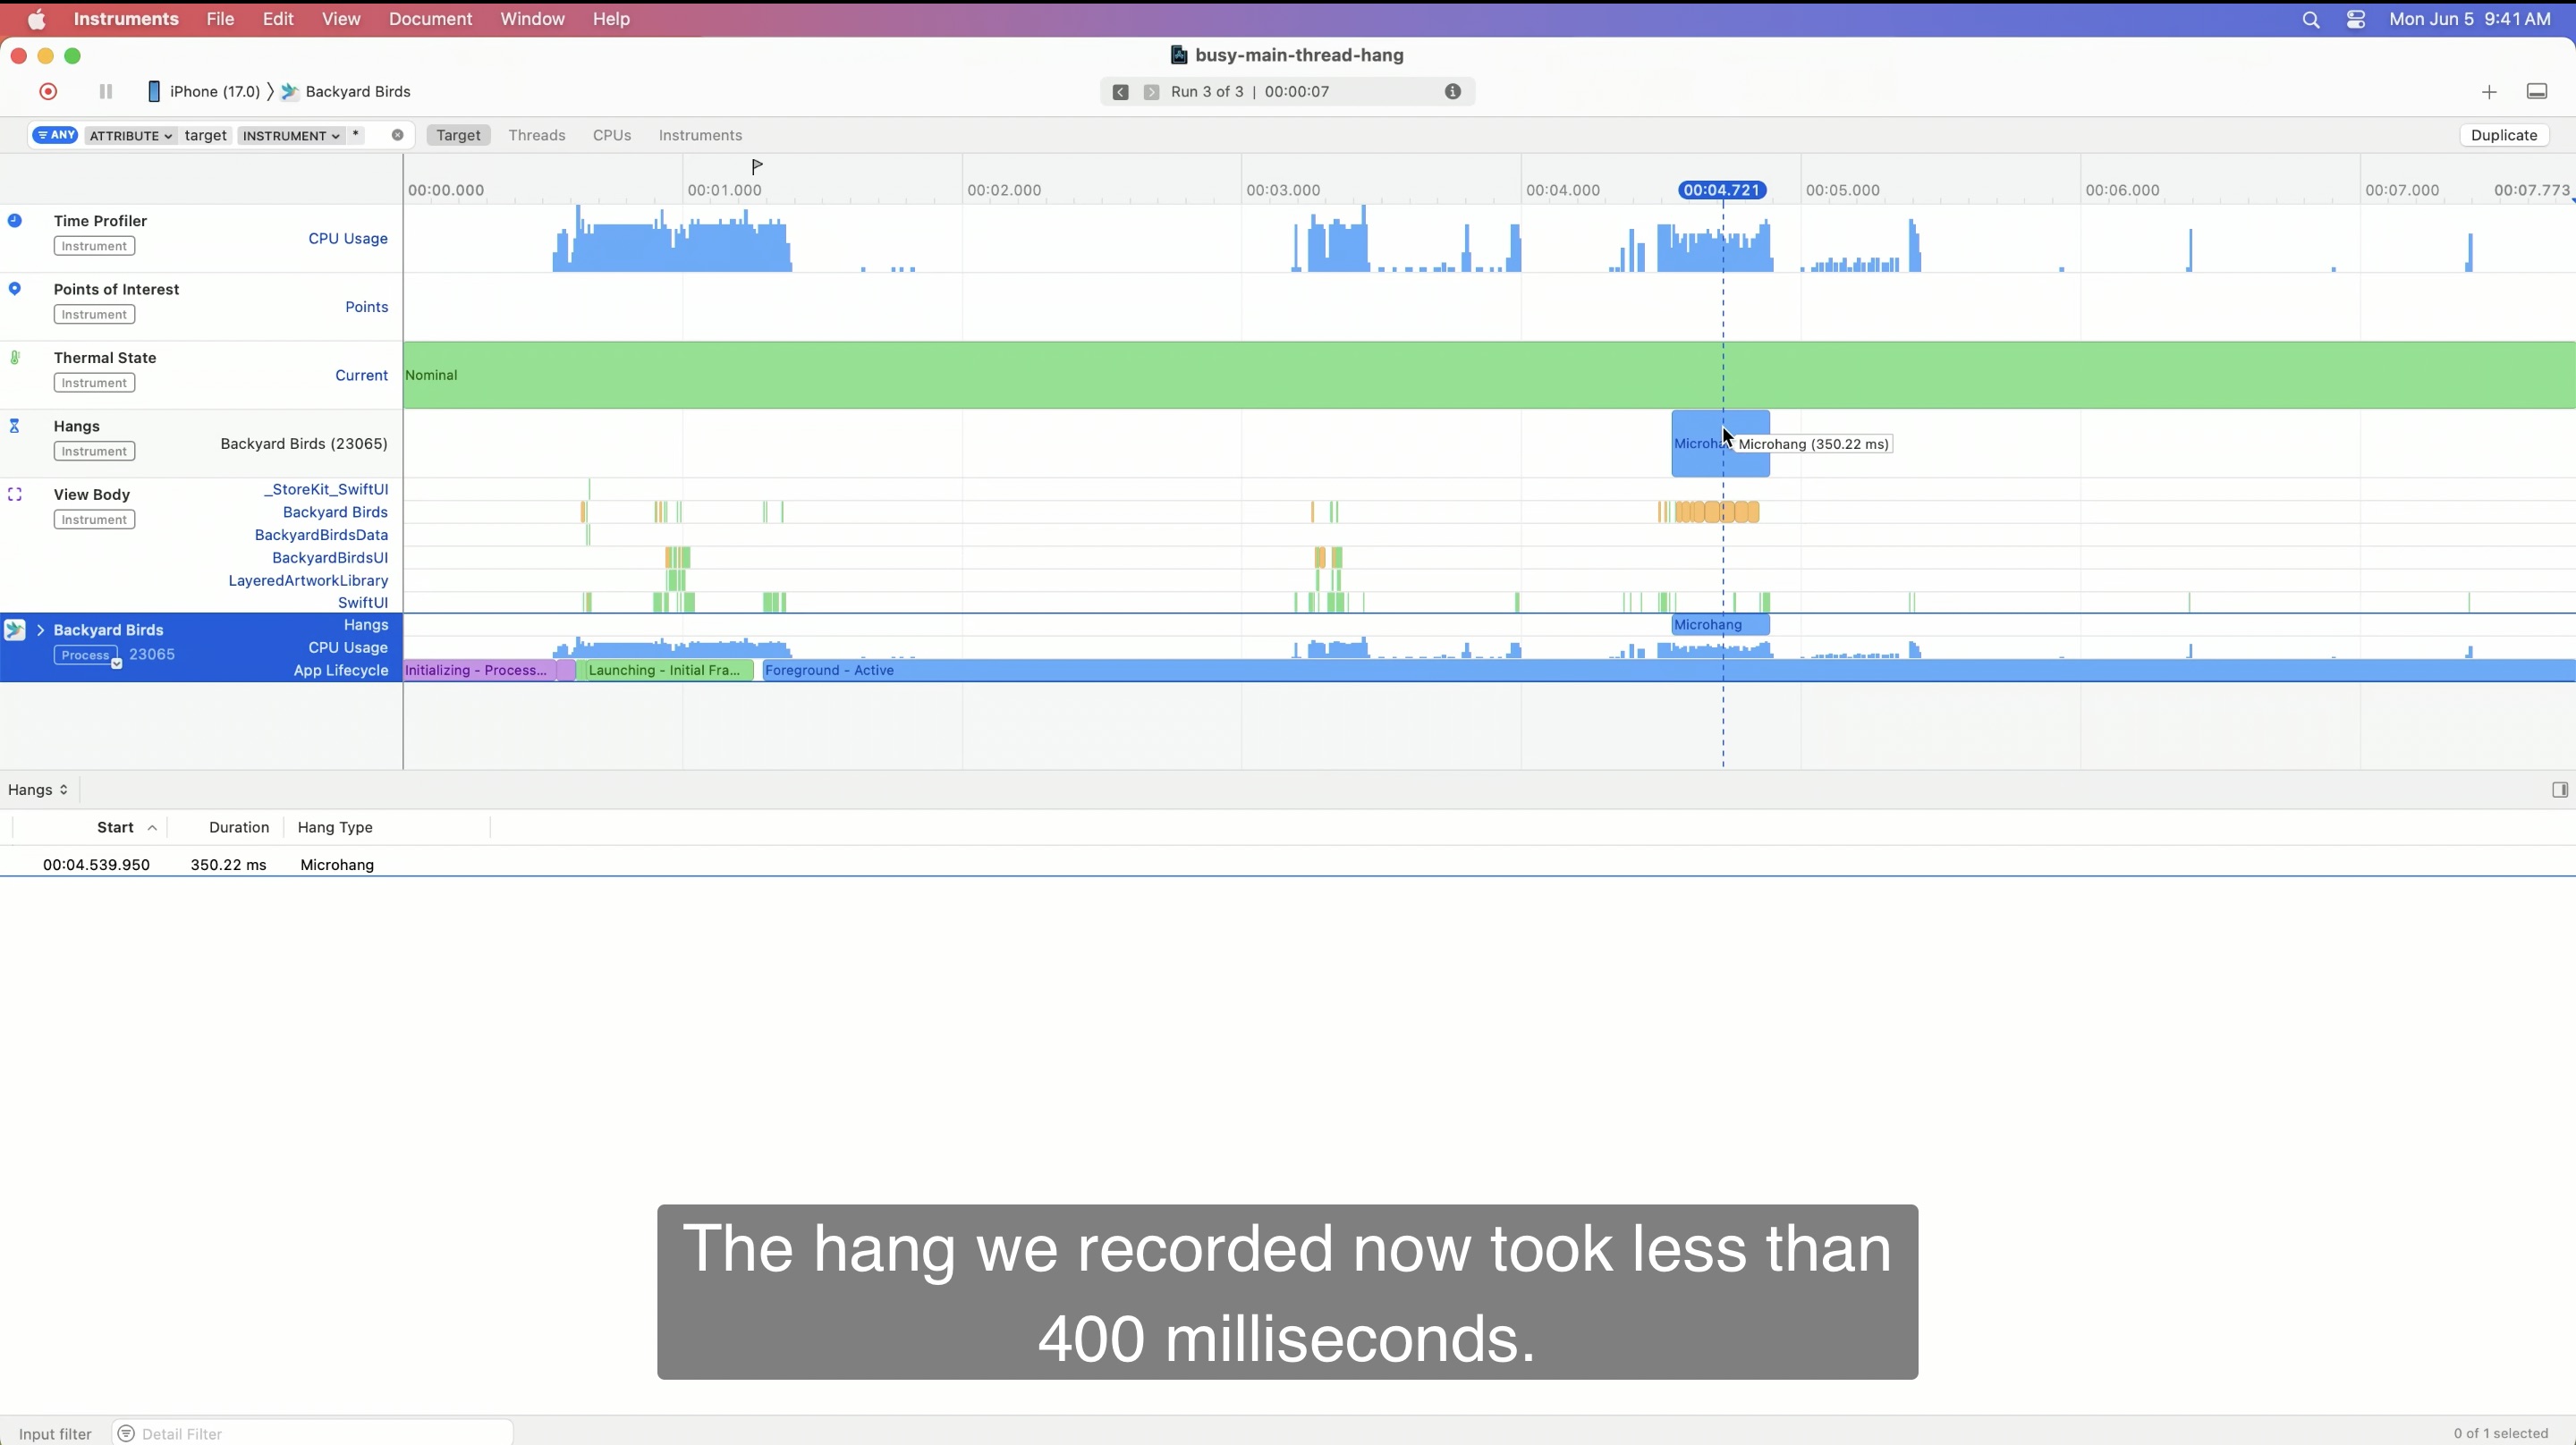
We still has a micro-hang. Let’s profile it on our iPad.
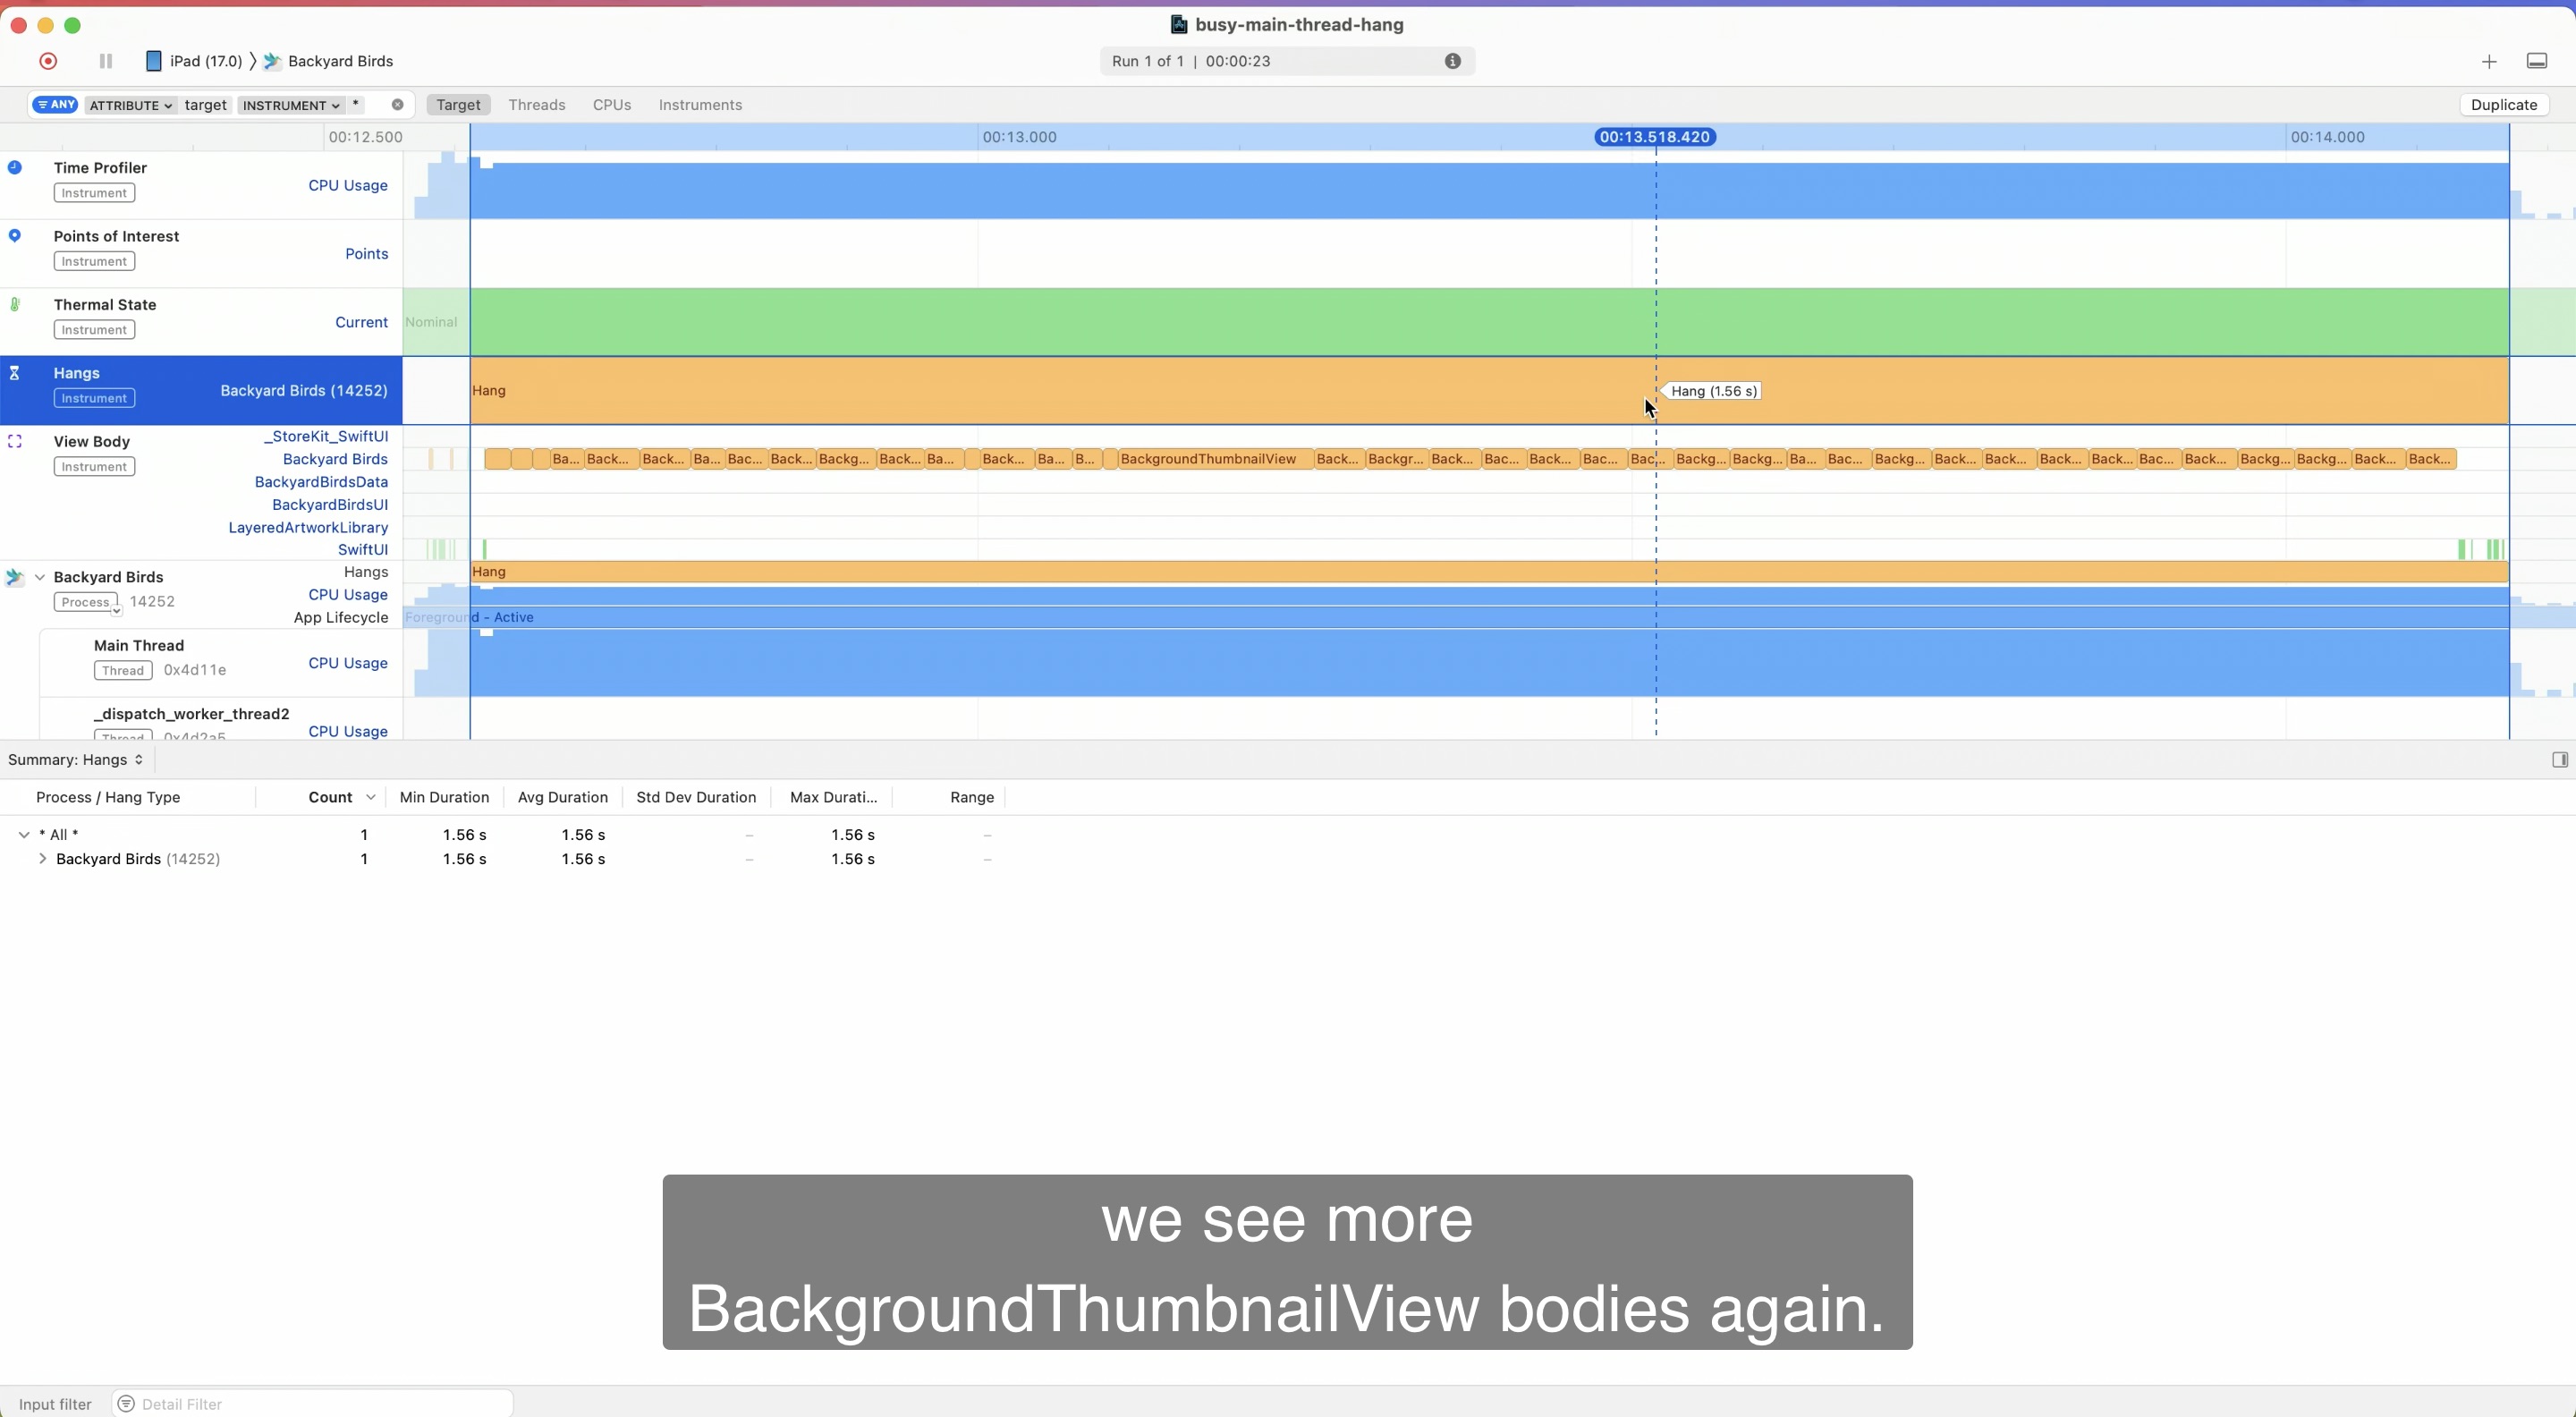
We still experience the hang on iPad. That’s because now our screen is bigger and there’re a lot more thumbnails to be rendered. Instruments also recorded this hang (see in below screenshot). We see more BackgroundThumbnailView bodies again.
The same code performed mostly OK on an iPhone but was slow on an iPad, simply because the screen was bigger. This is one of the reasons why you should also fix micro hangs. Let’s find out what we can do to make each individual execution faster.
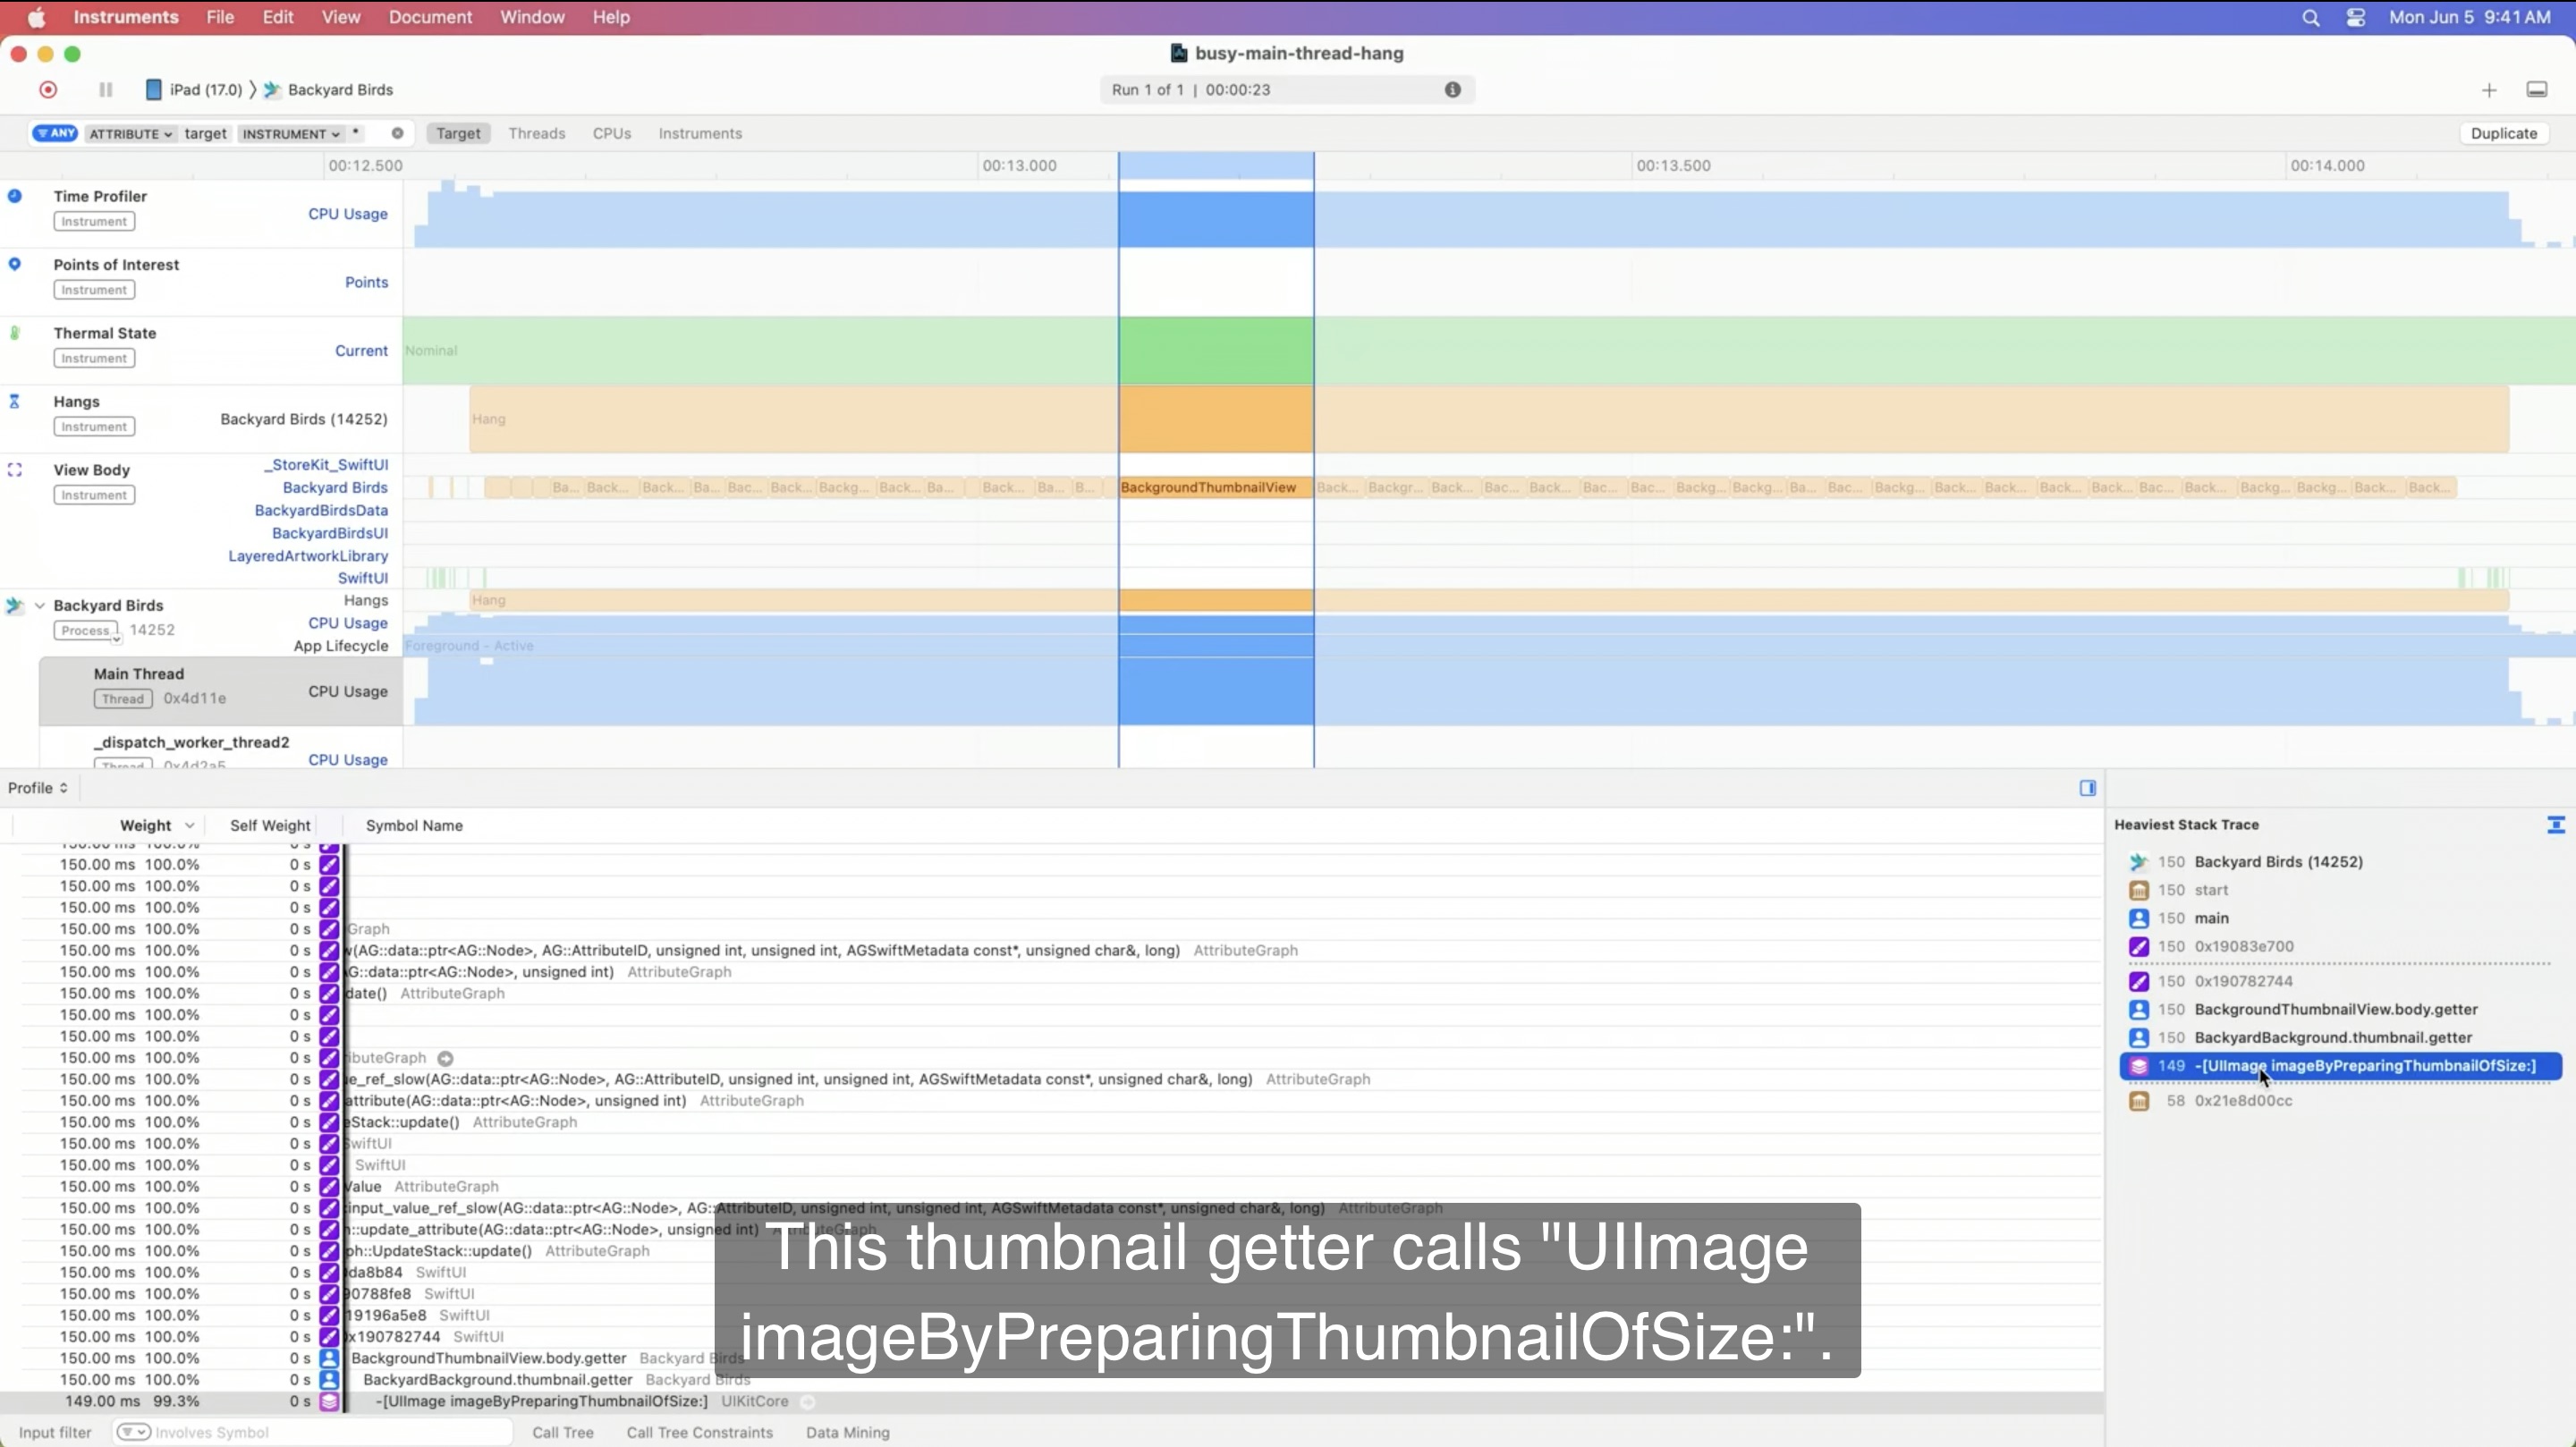
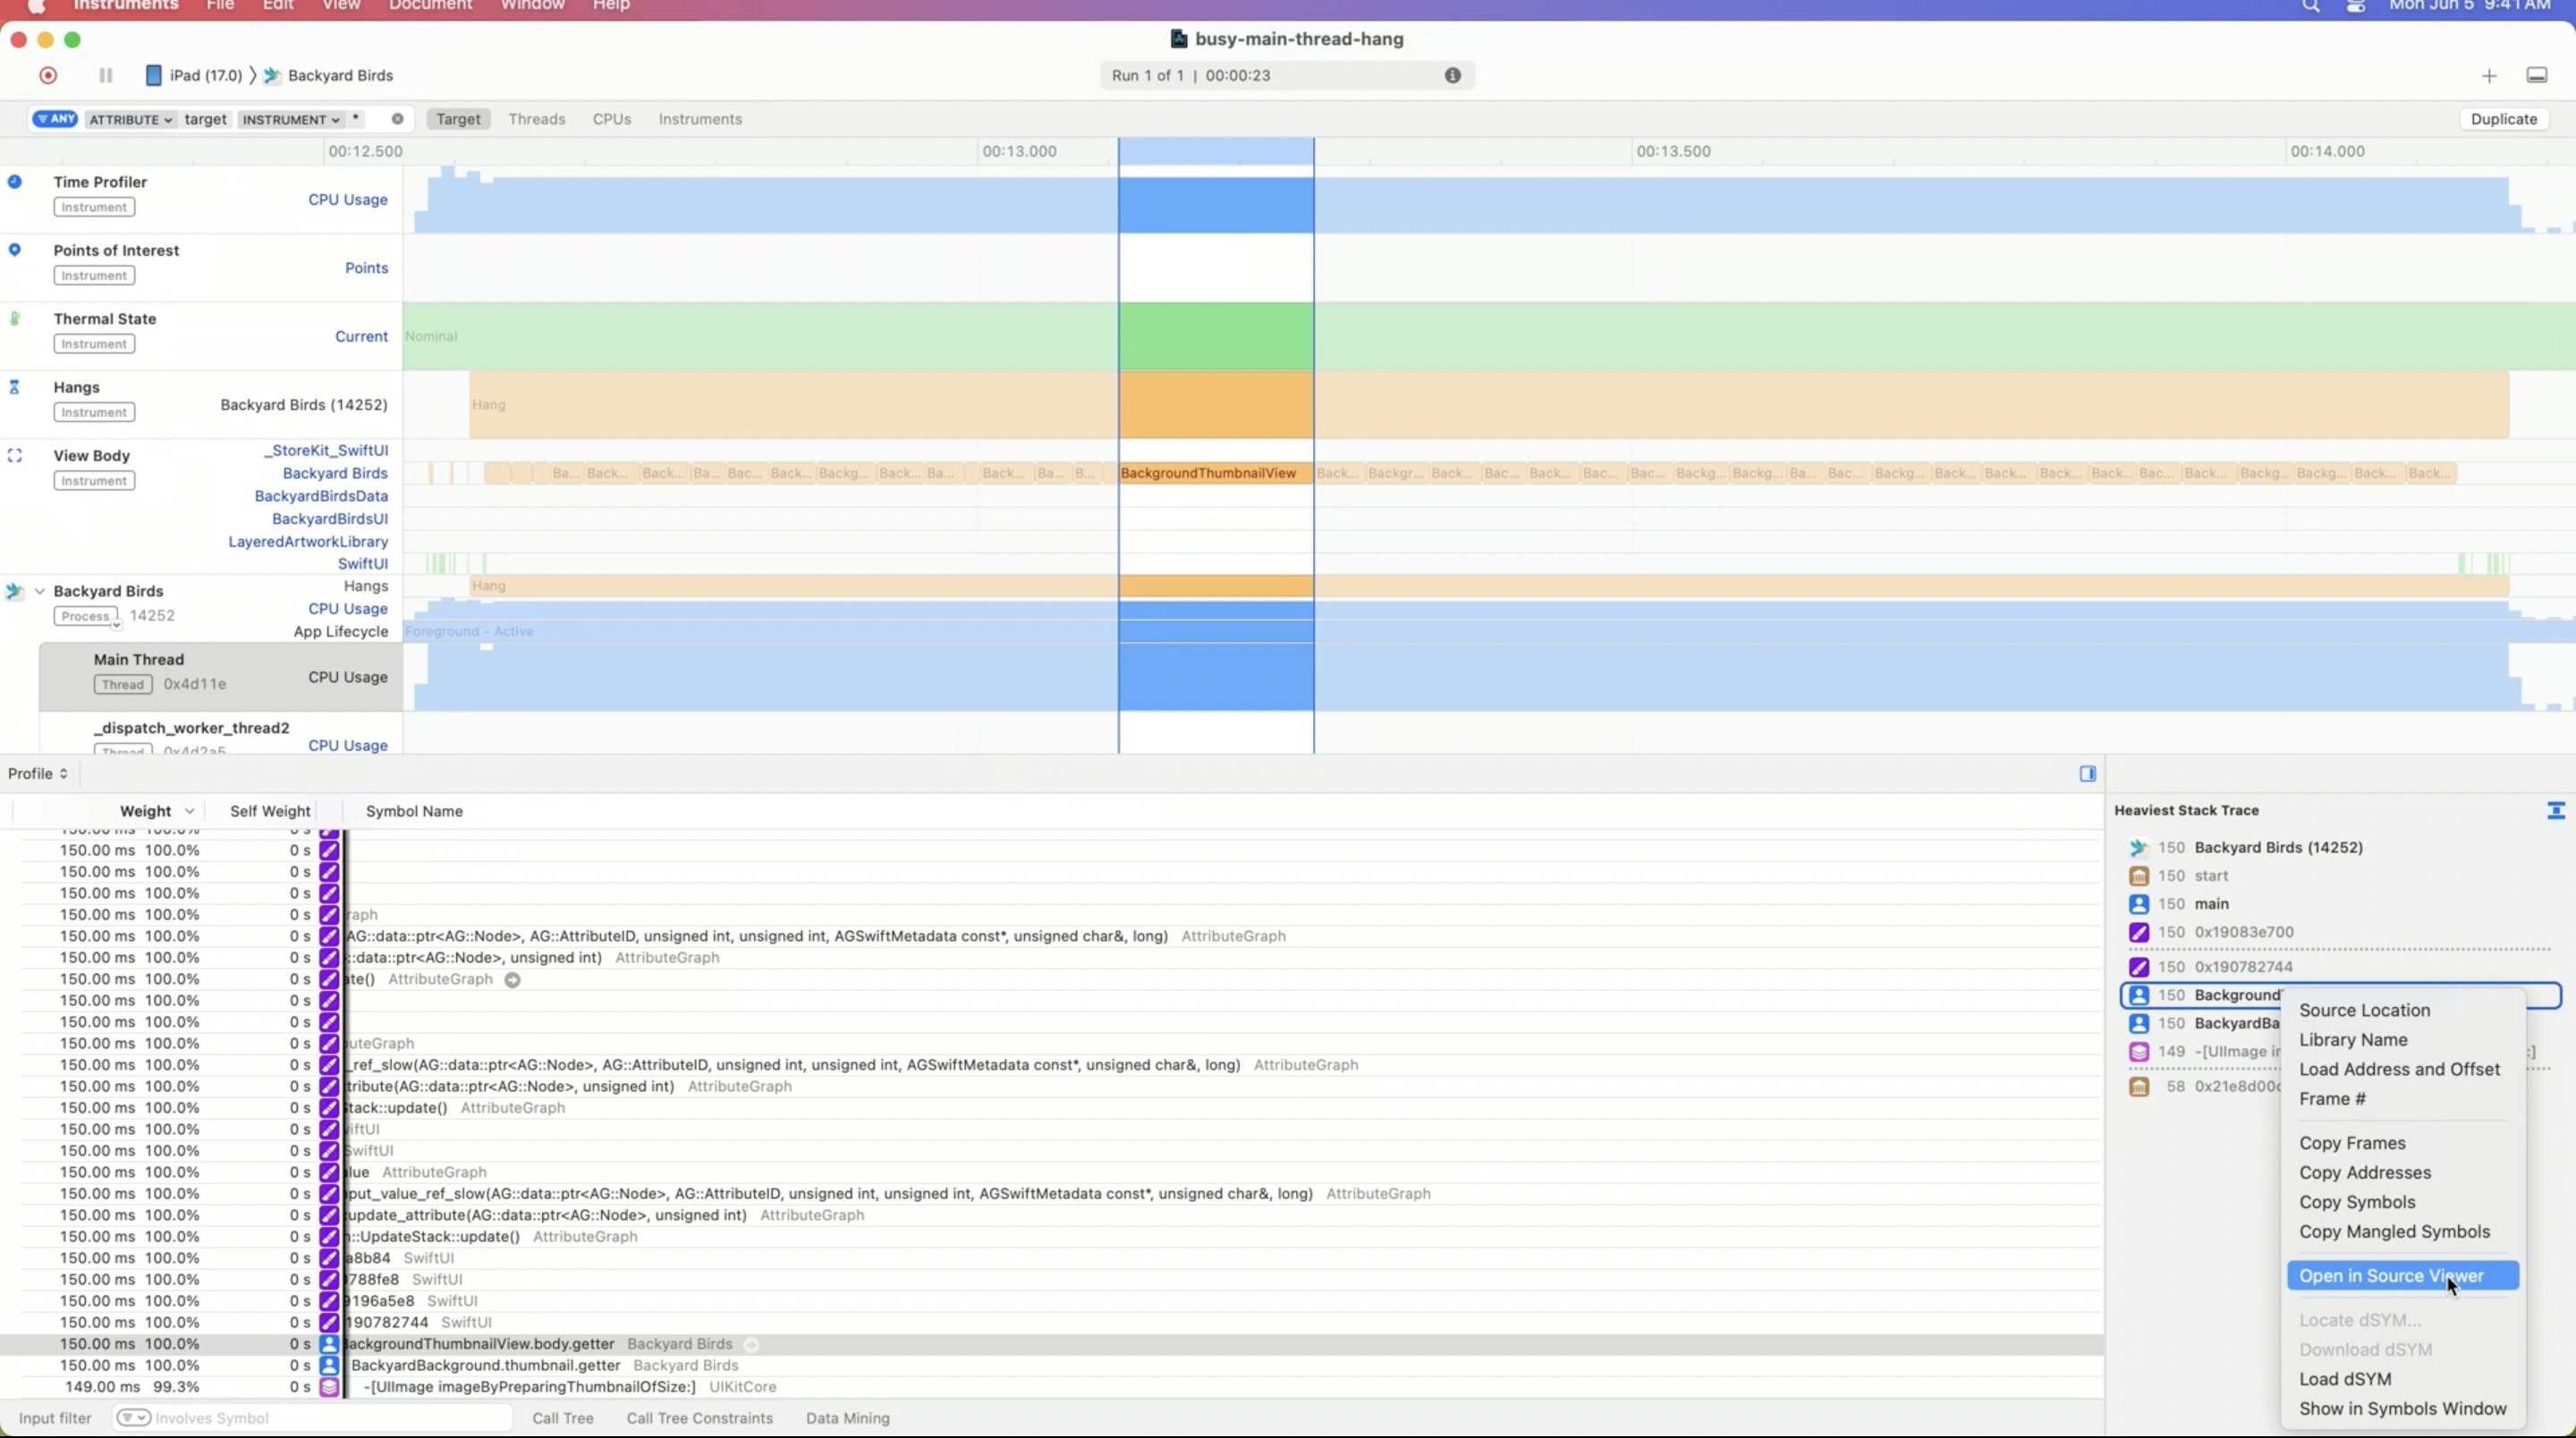
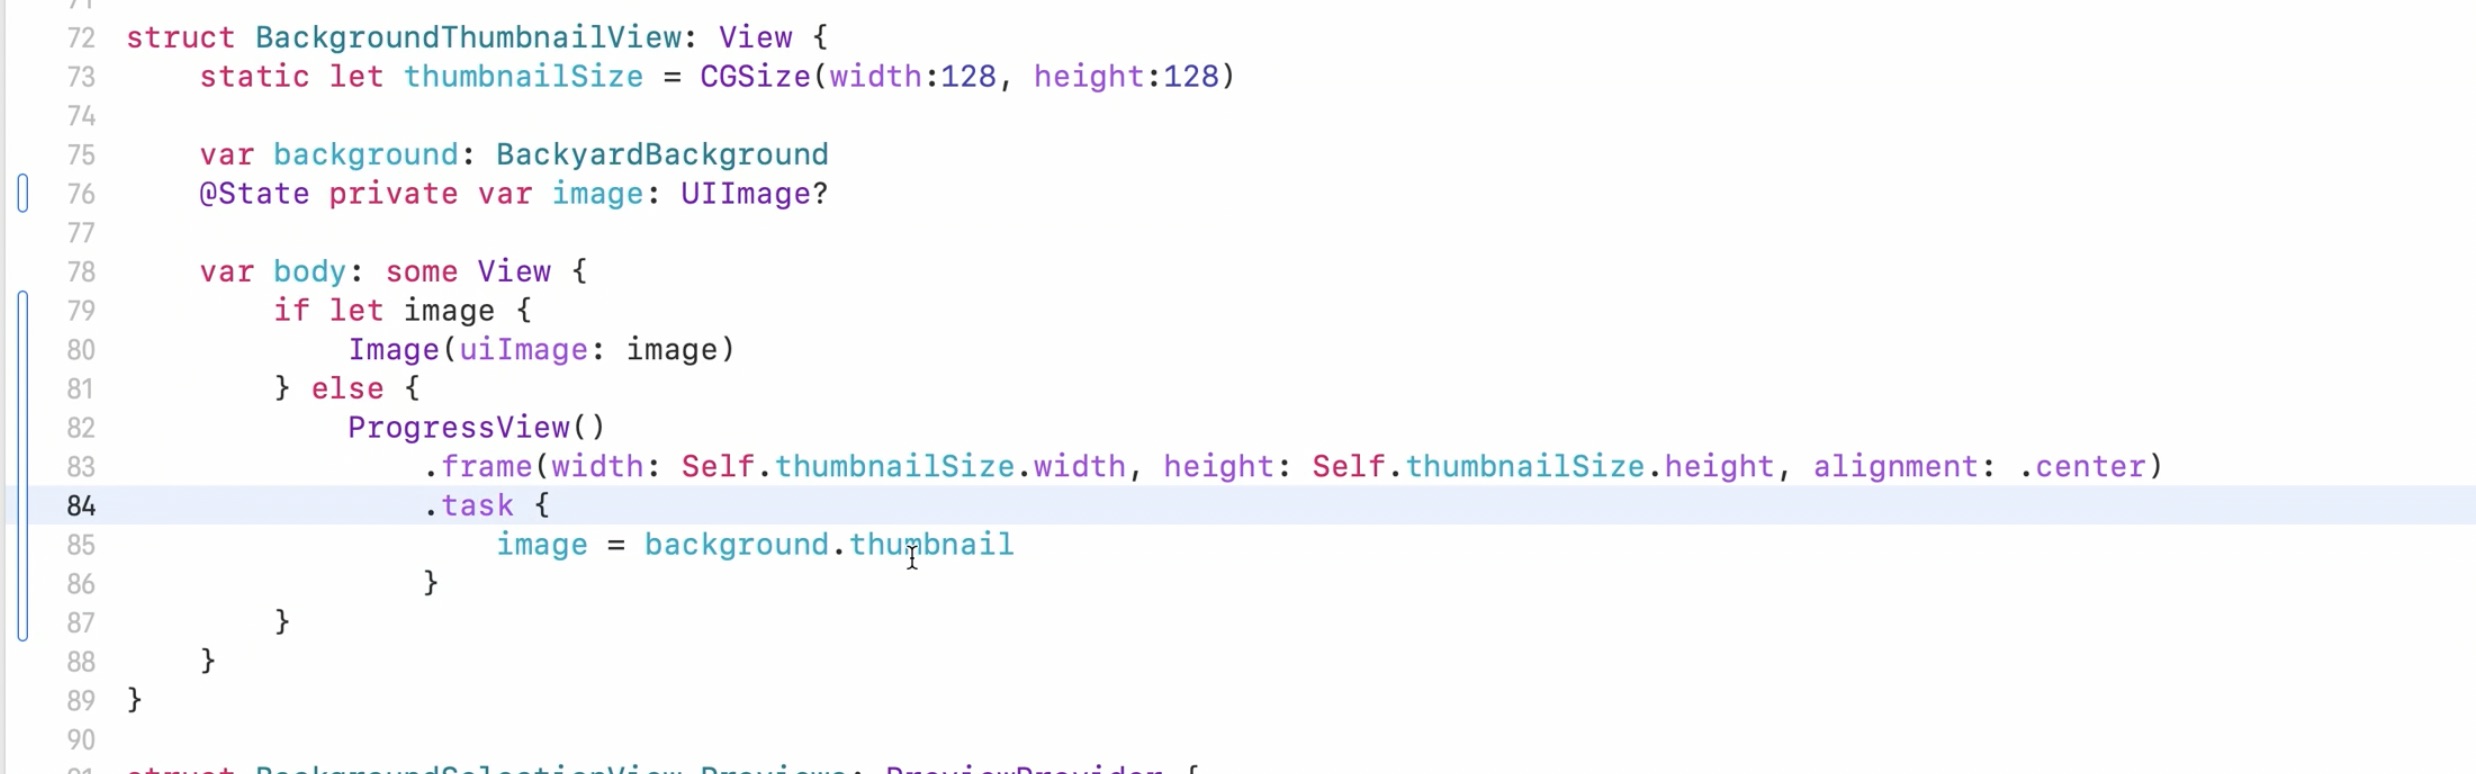
We seem to be computing a thumbnail on the fly here, which is quite time consuming. This is work we should rather be doing in the background and not keep the main thread busy with. To better understand what change we can make, let’s look at the context how the thumbnail getter is called.
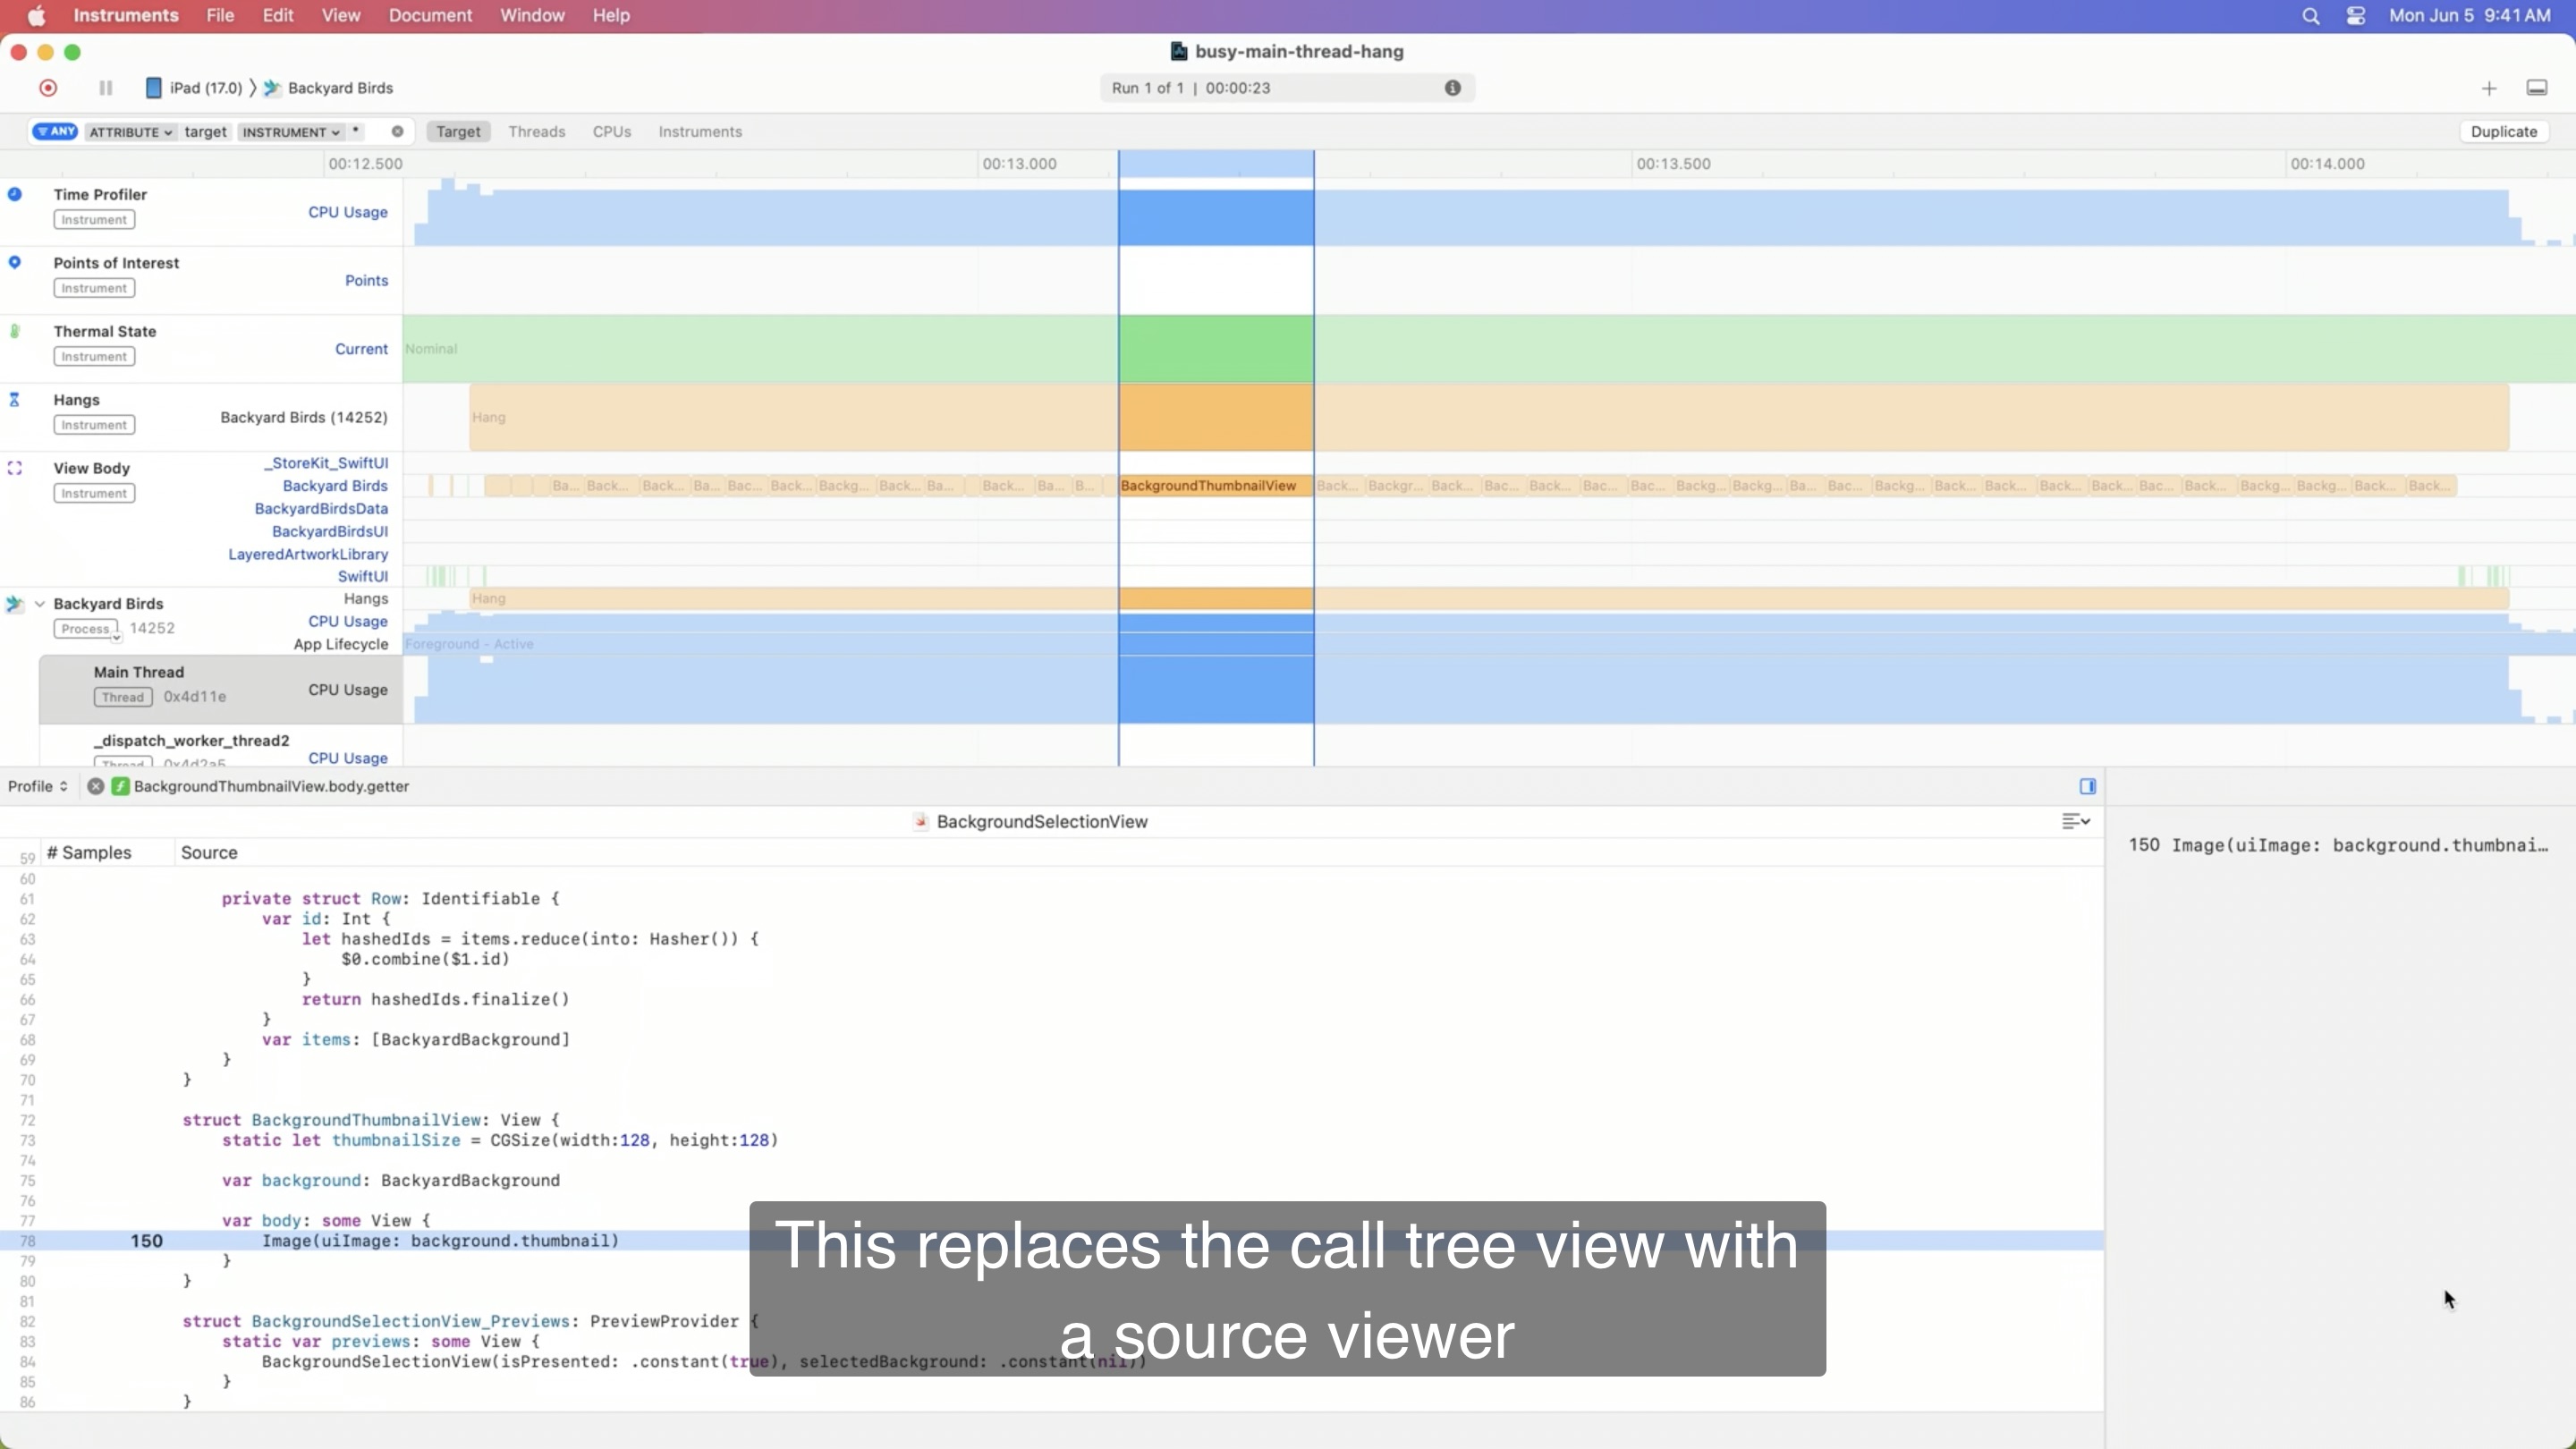
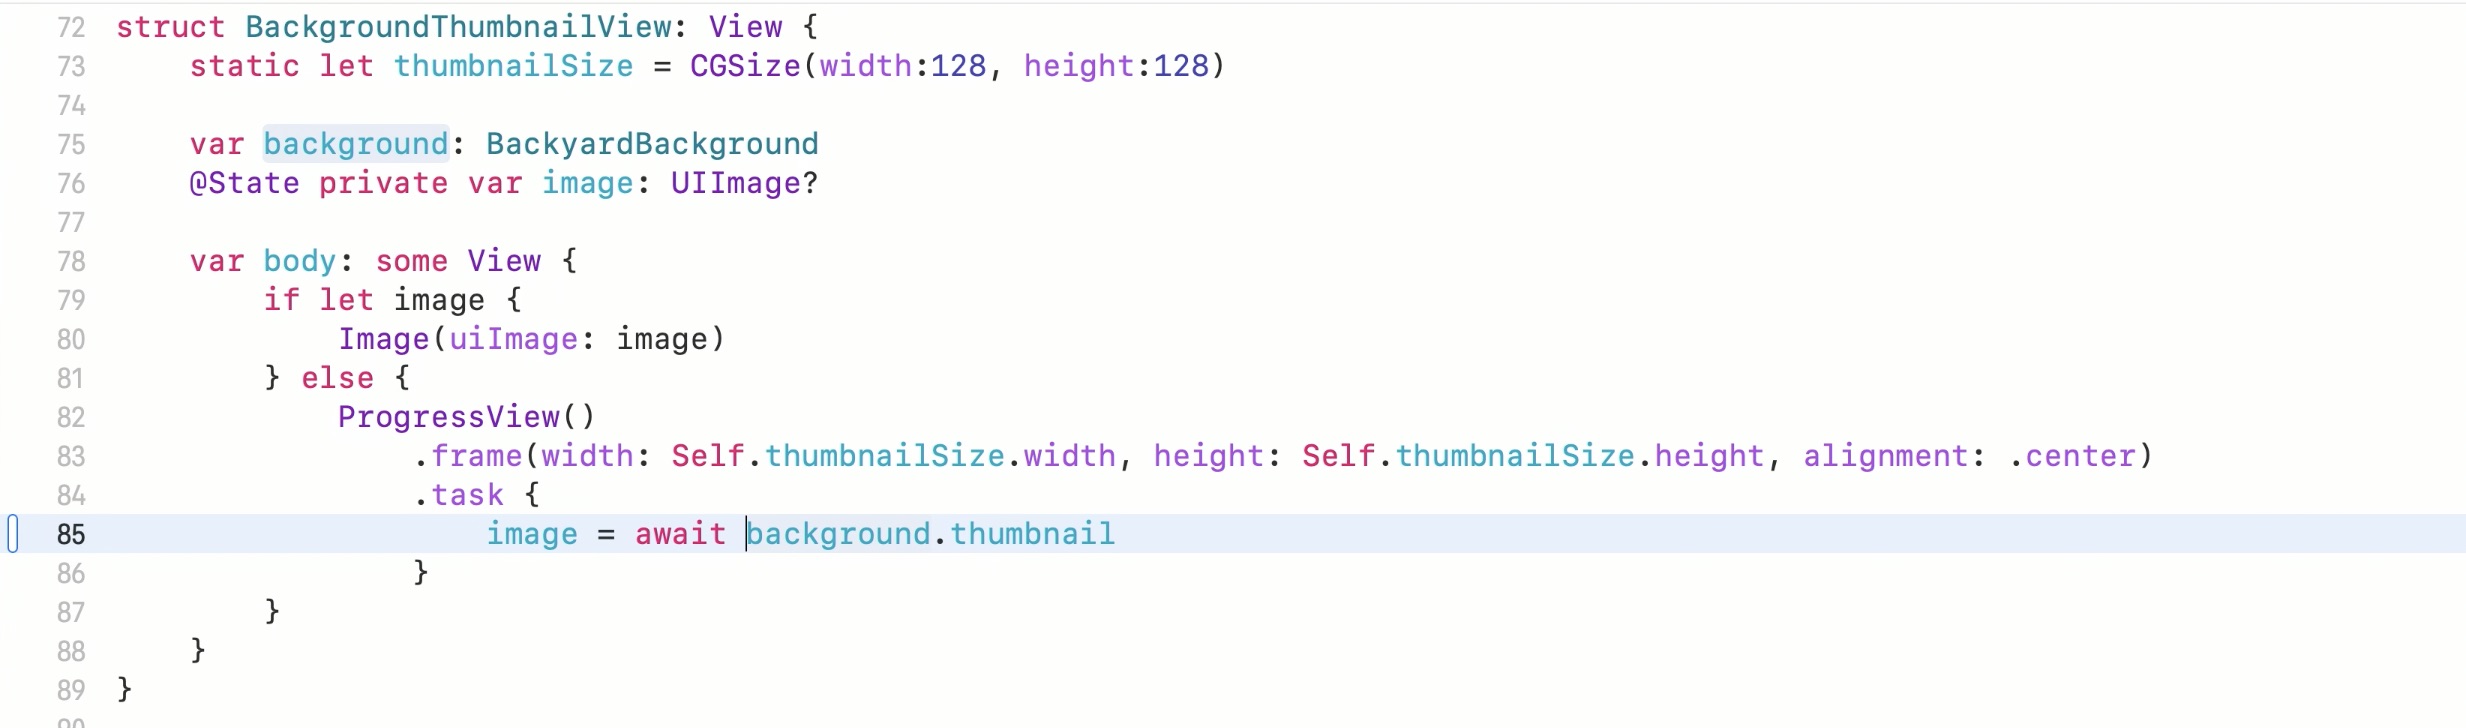
And update our code to show progress view while loading the actual image.
Let’s try out the updated code. You will our progress indicators, and a few seconds later, our thumbnails were displayed.
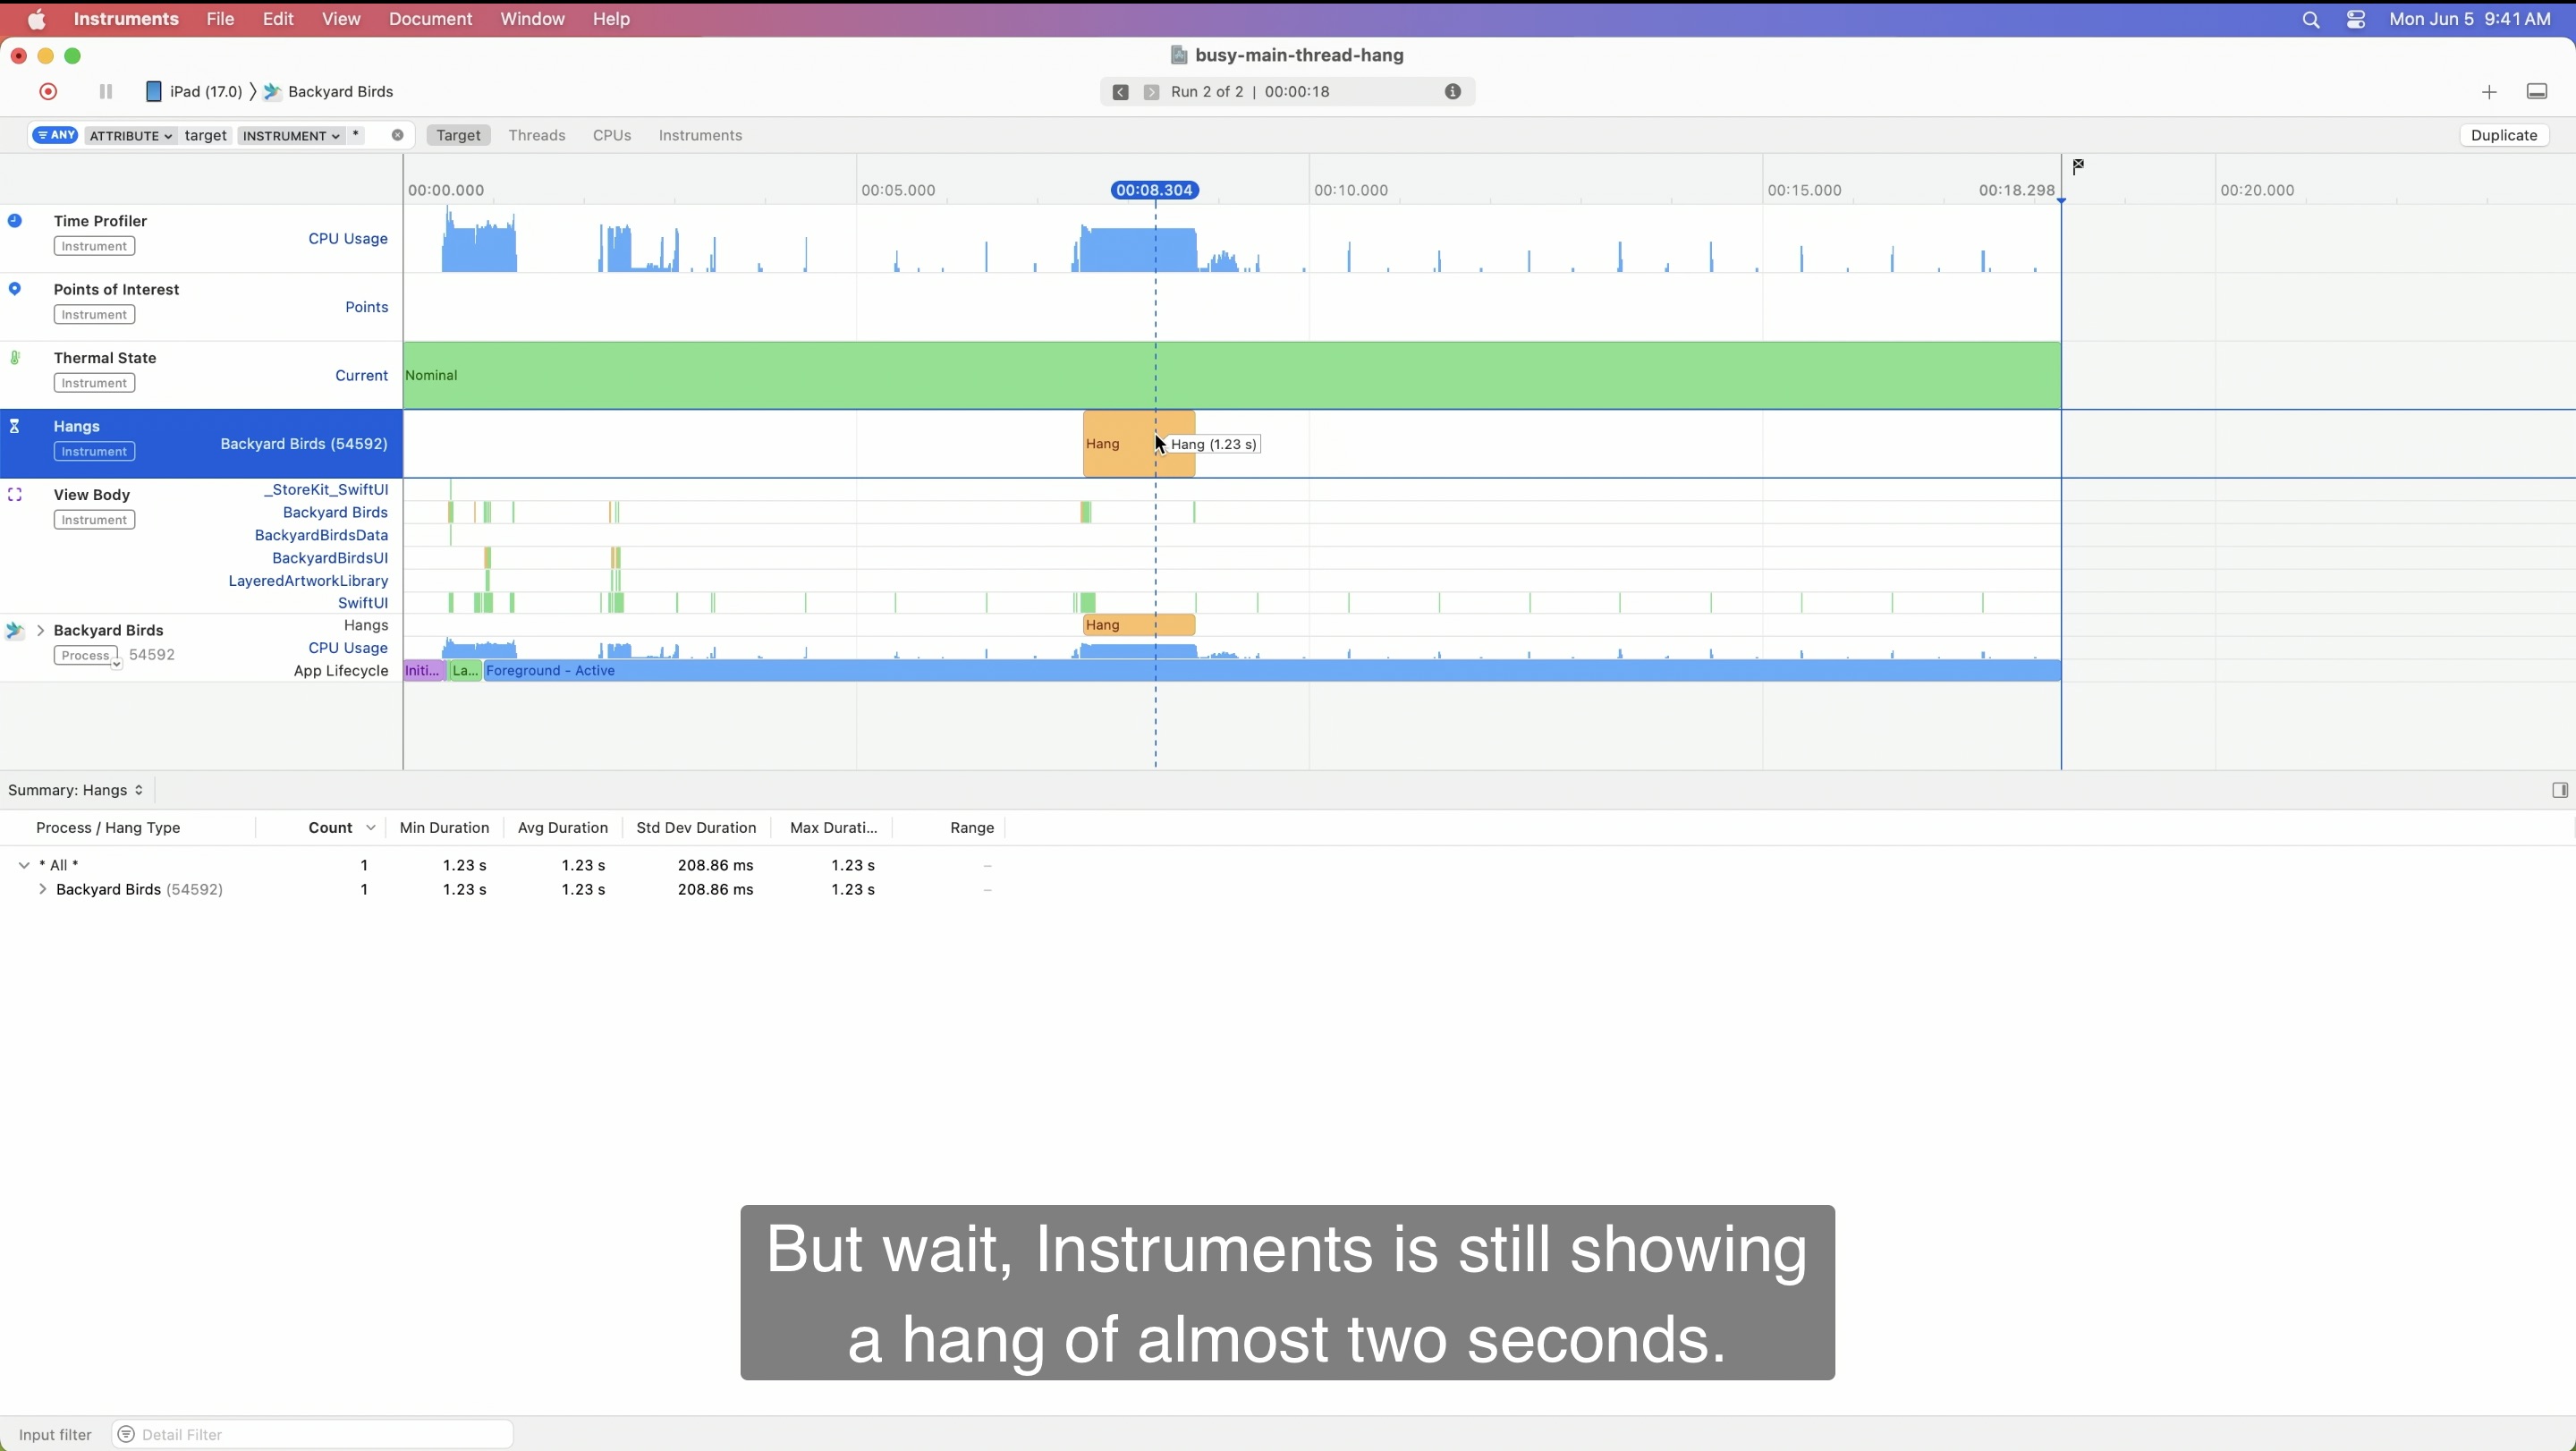
This is the slightly different type of hangs. The way Instruments’ hang detection works is that it looks at all works items on the main thread and check whether they are too long. If so, it marks them as potential hang. Hang detection also detects these asynchronous or delayed cases, but it only measures the potential delay, not the actually experienced delay.
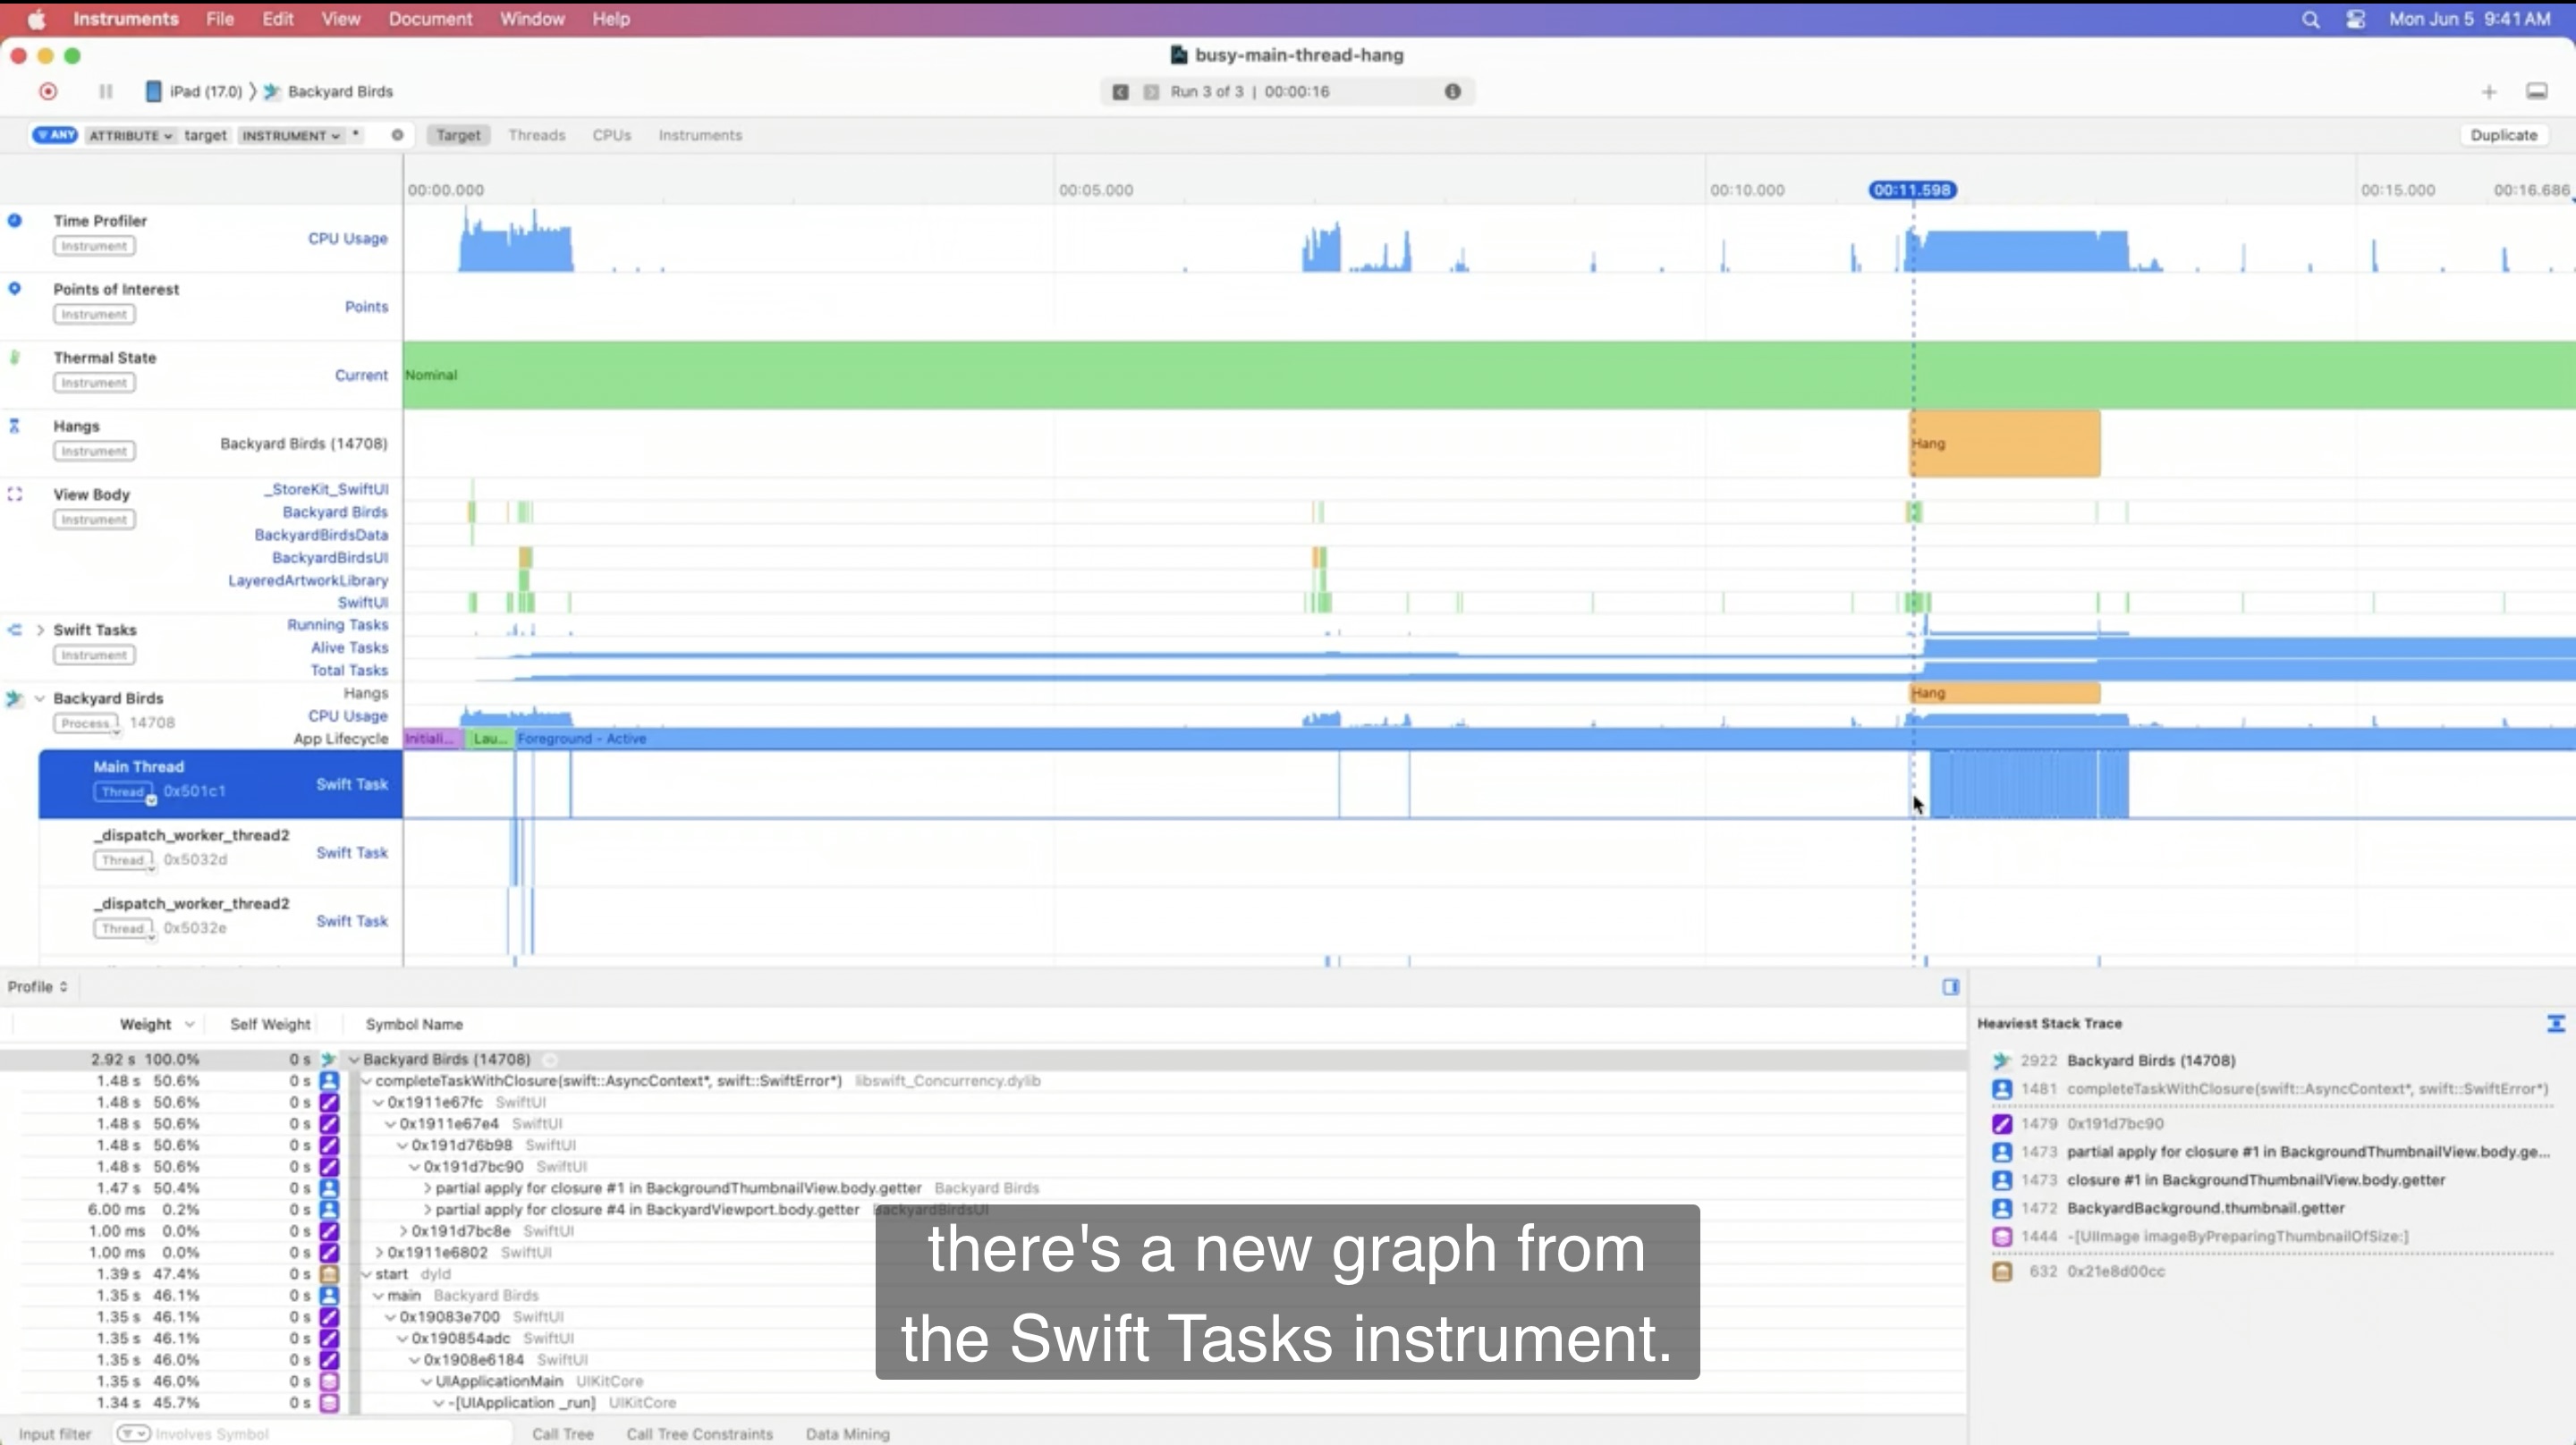
The problem (executing asynchronous task on main thread)
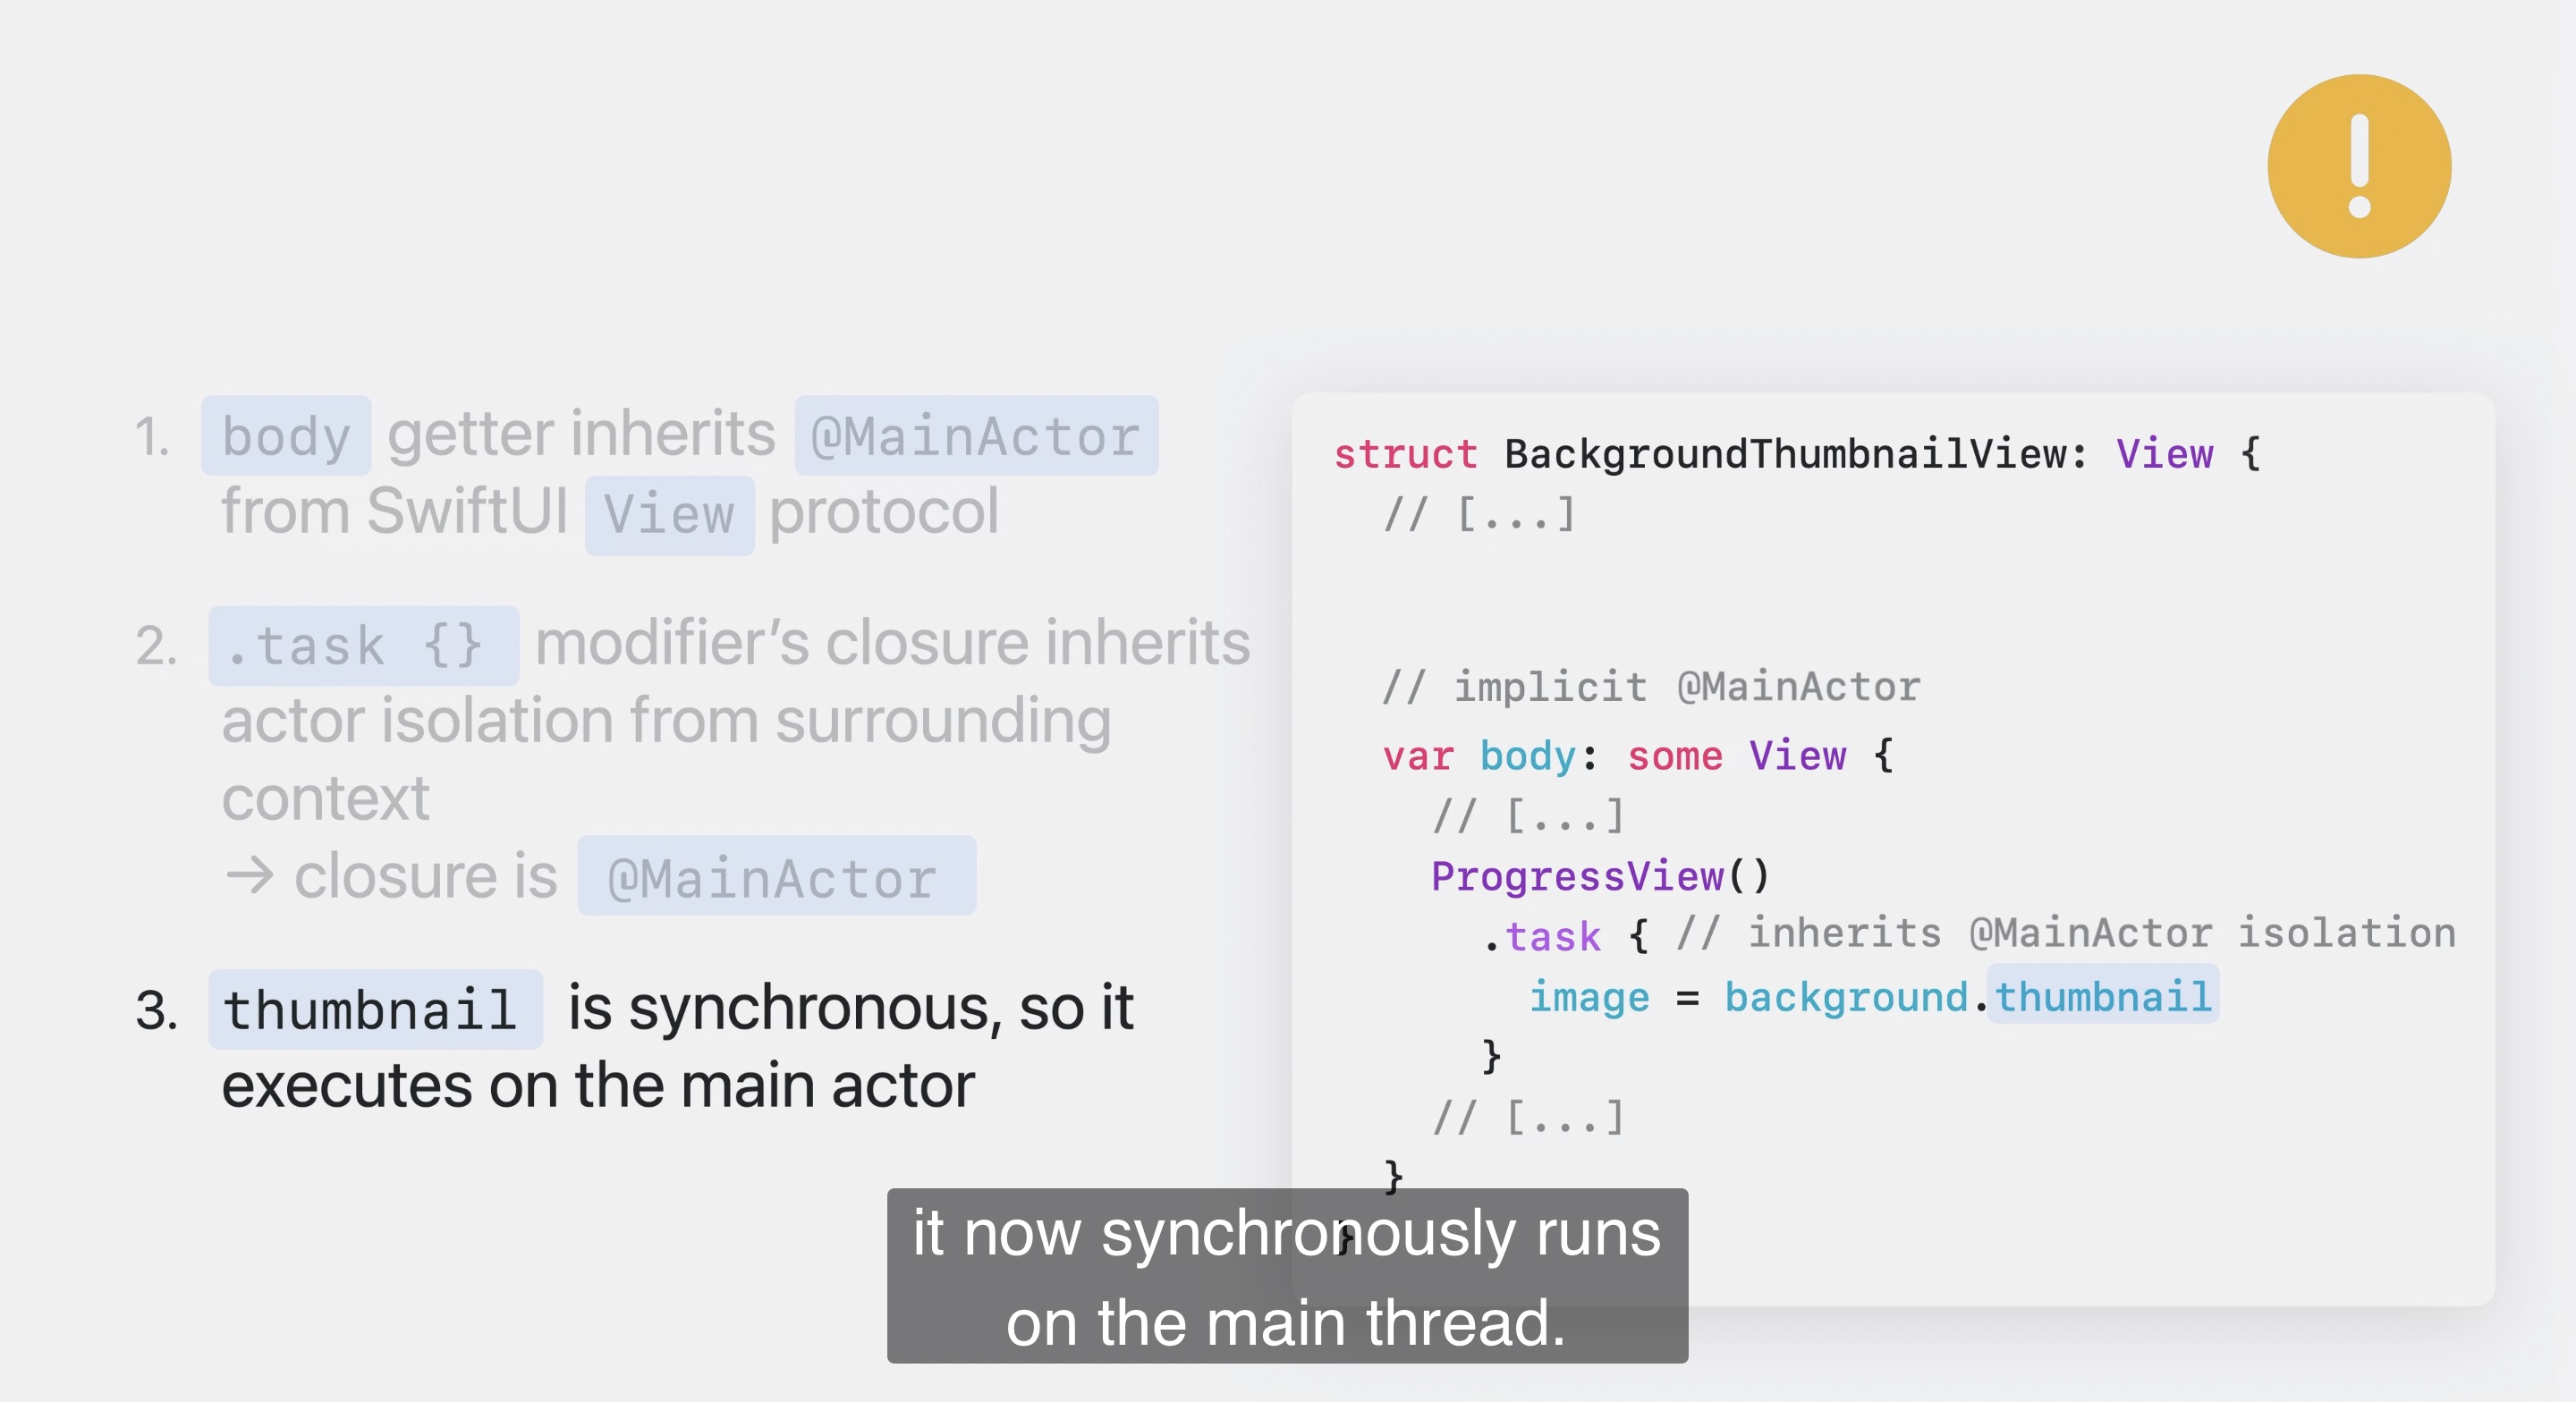
The solution
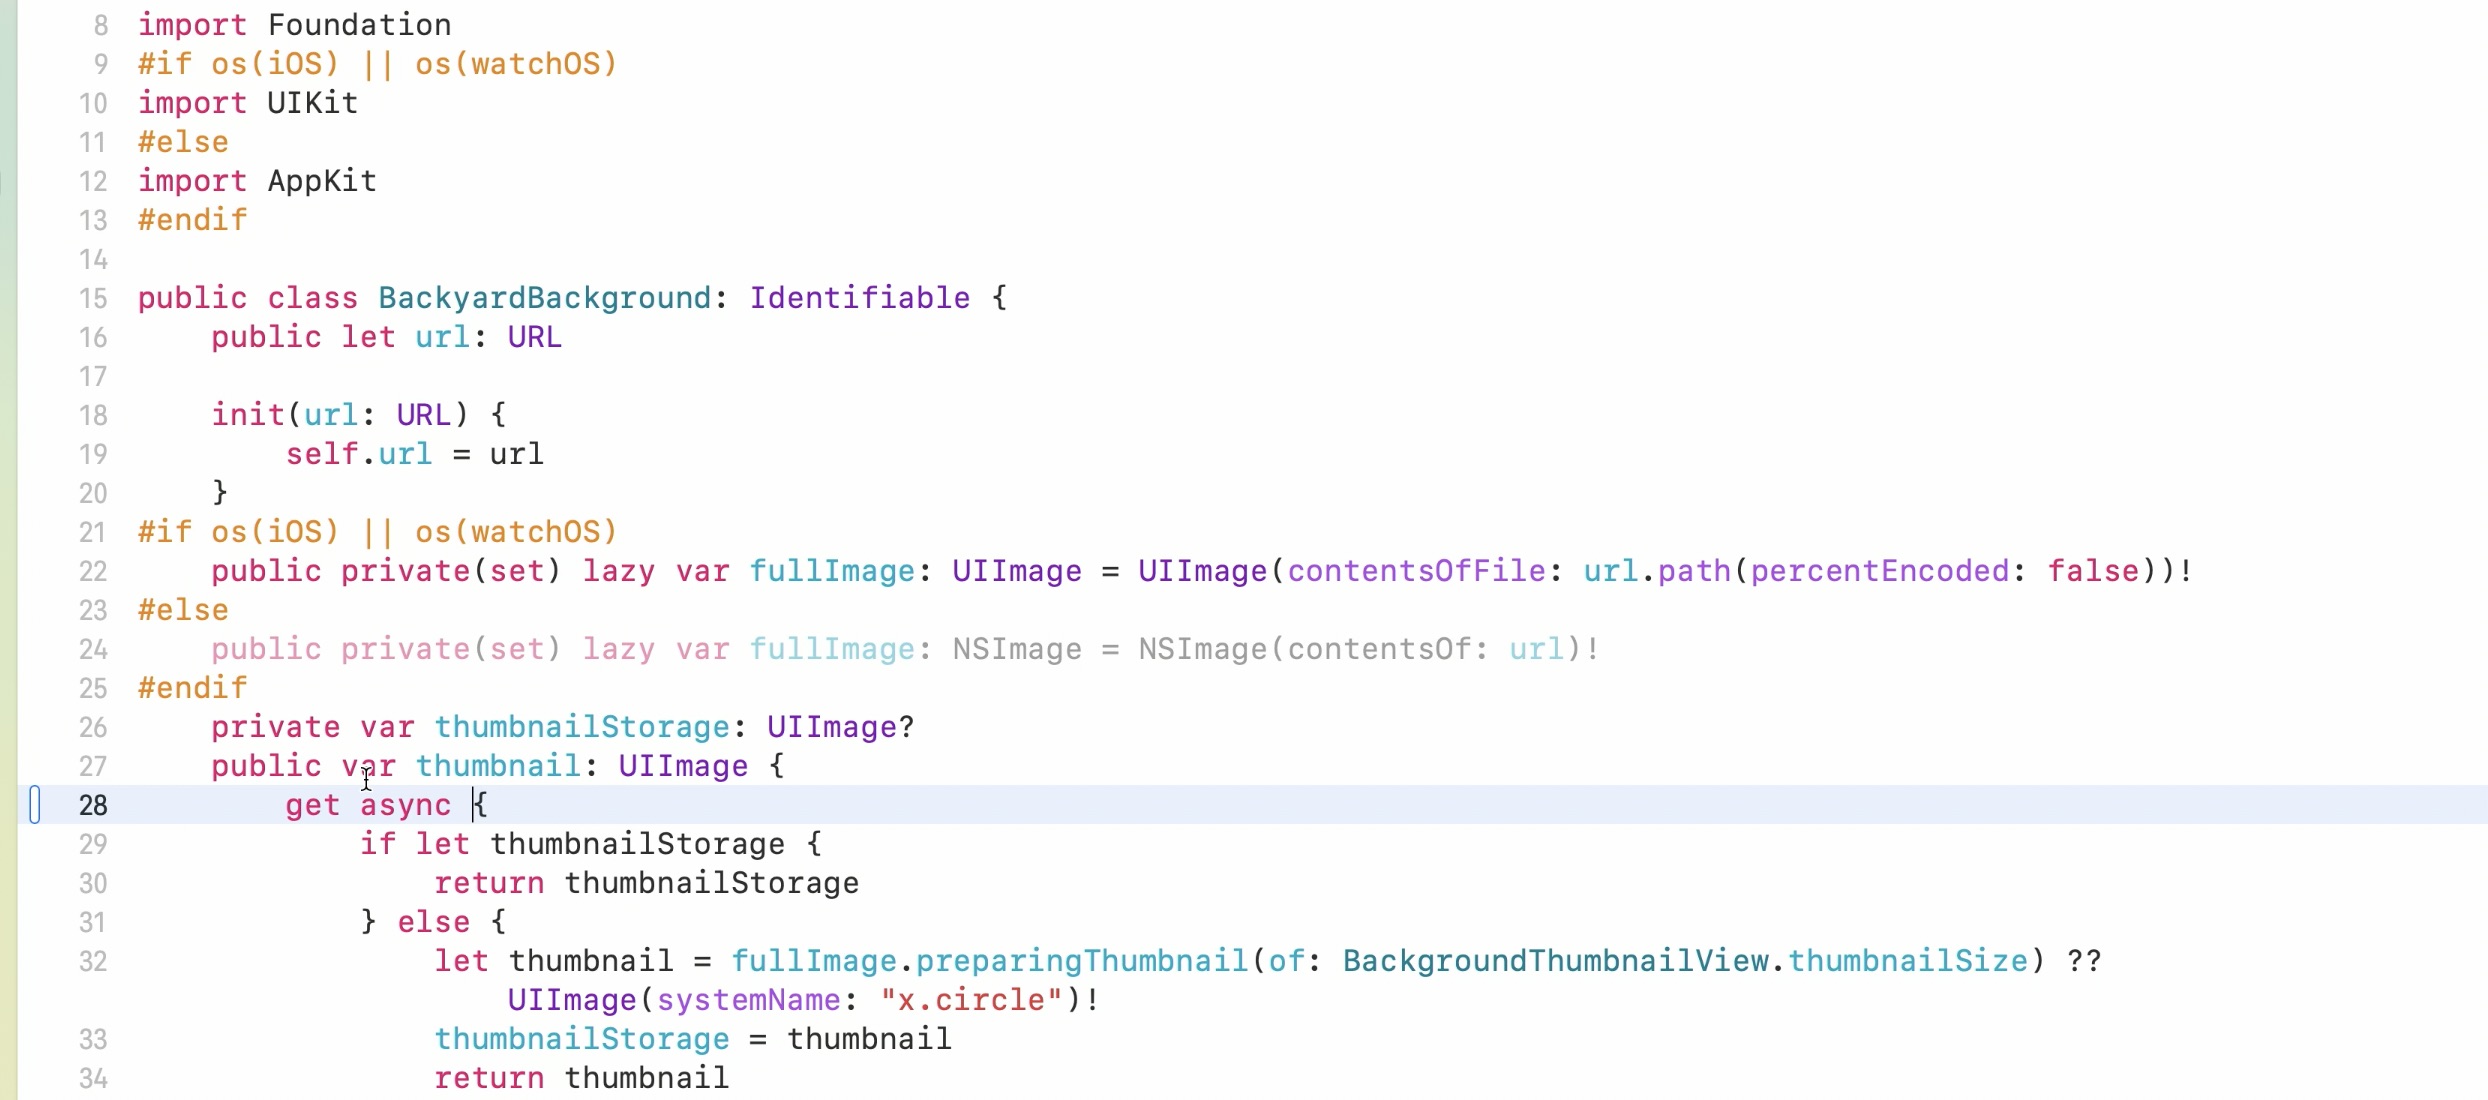
This should allow the “thumbnail” getter to execute on Swift Concurrency’s concurrent thread pool inside of the main thread. Let’s try it out again.
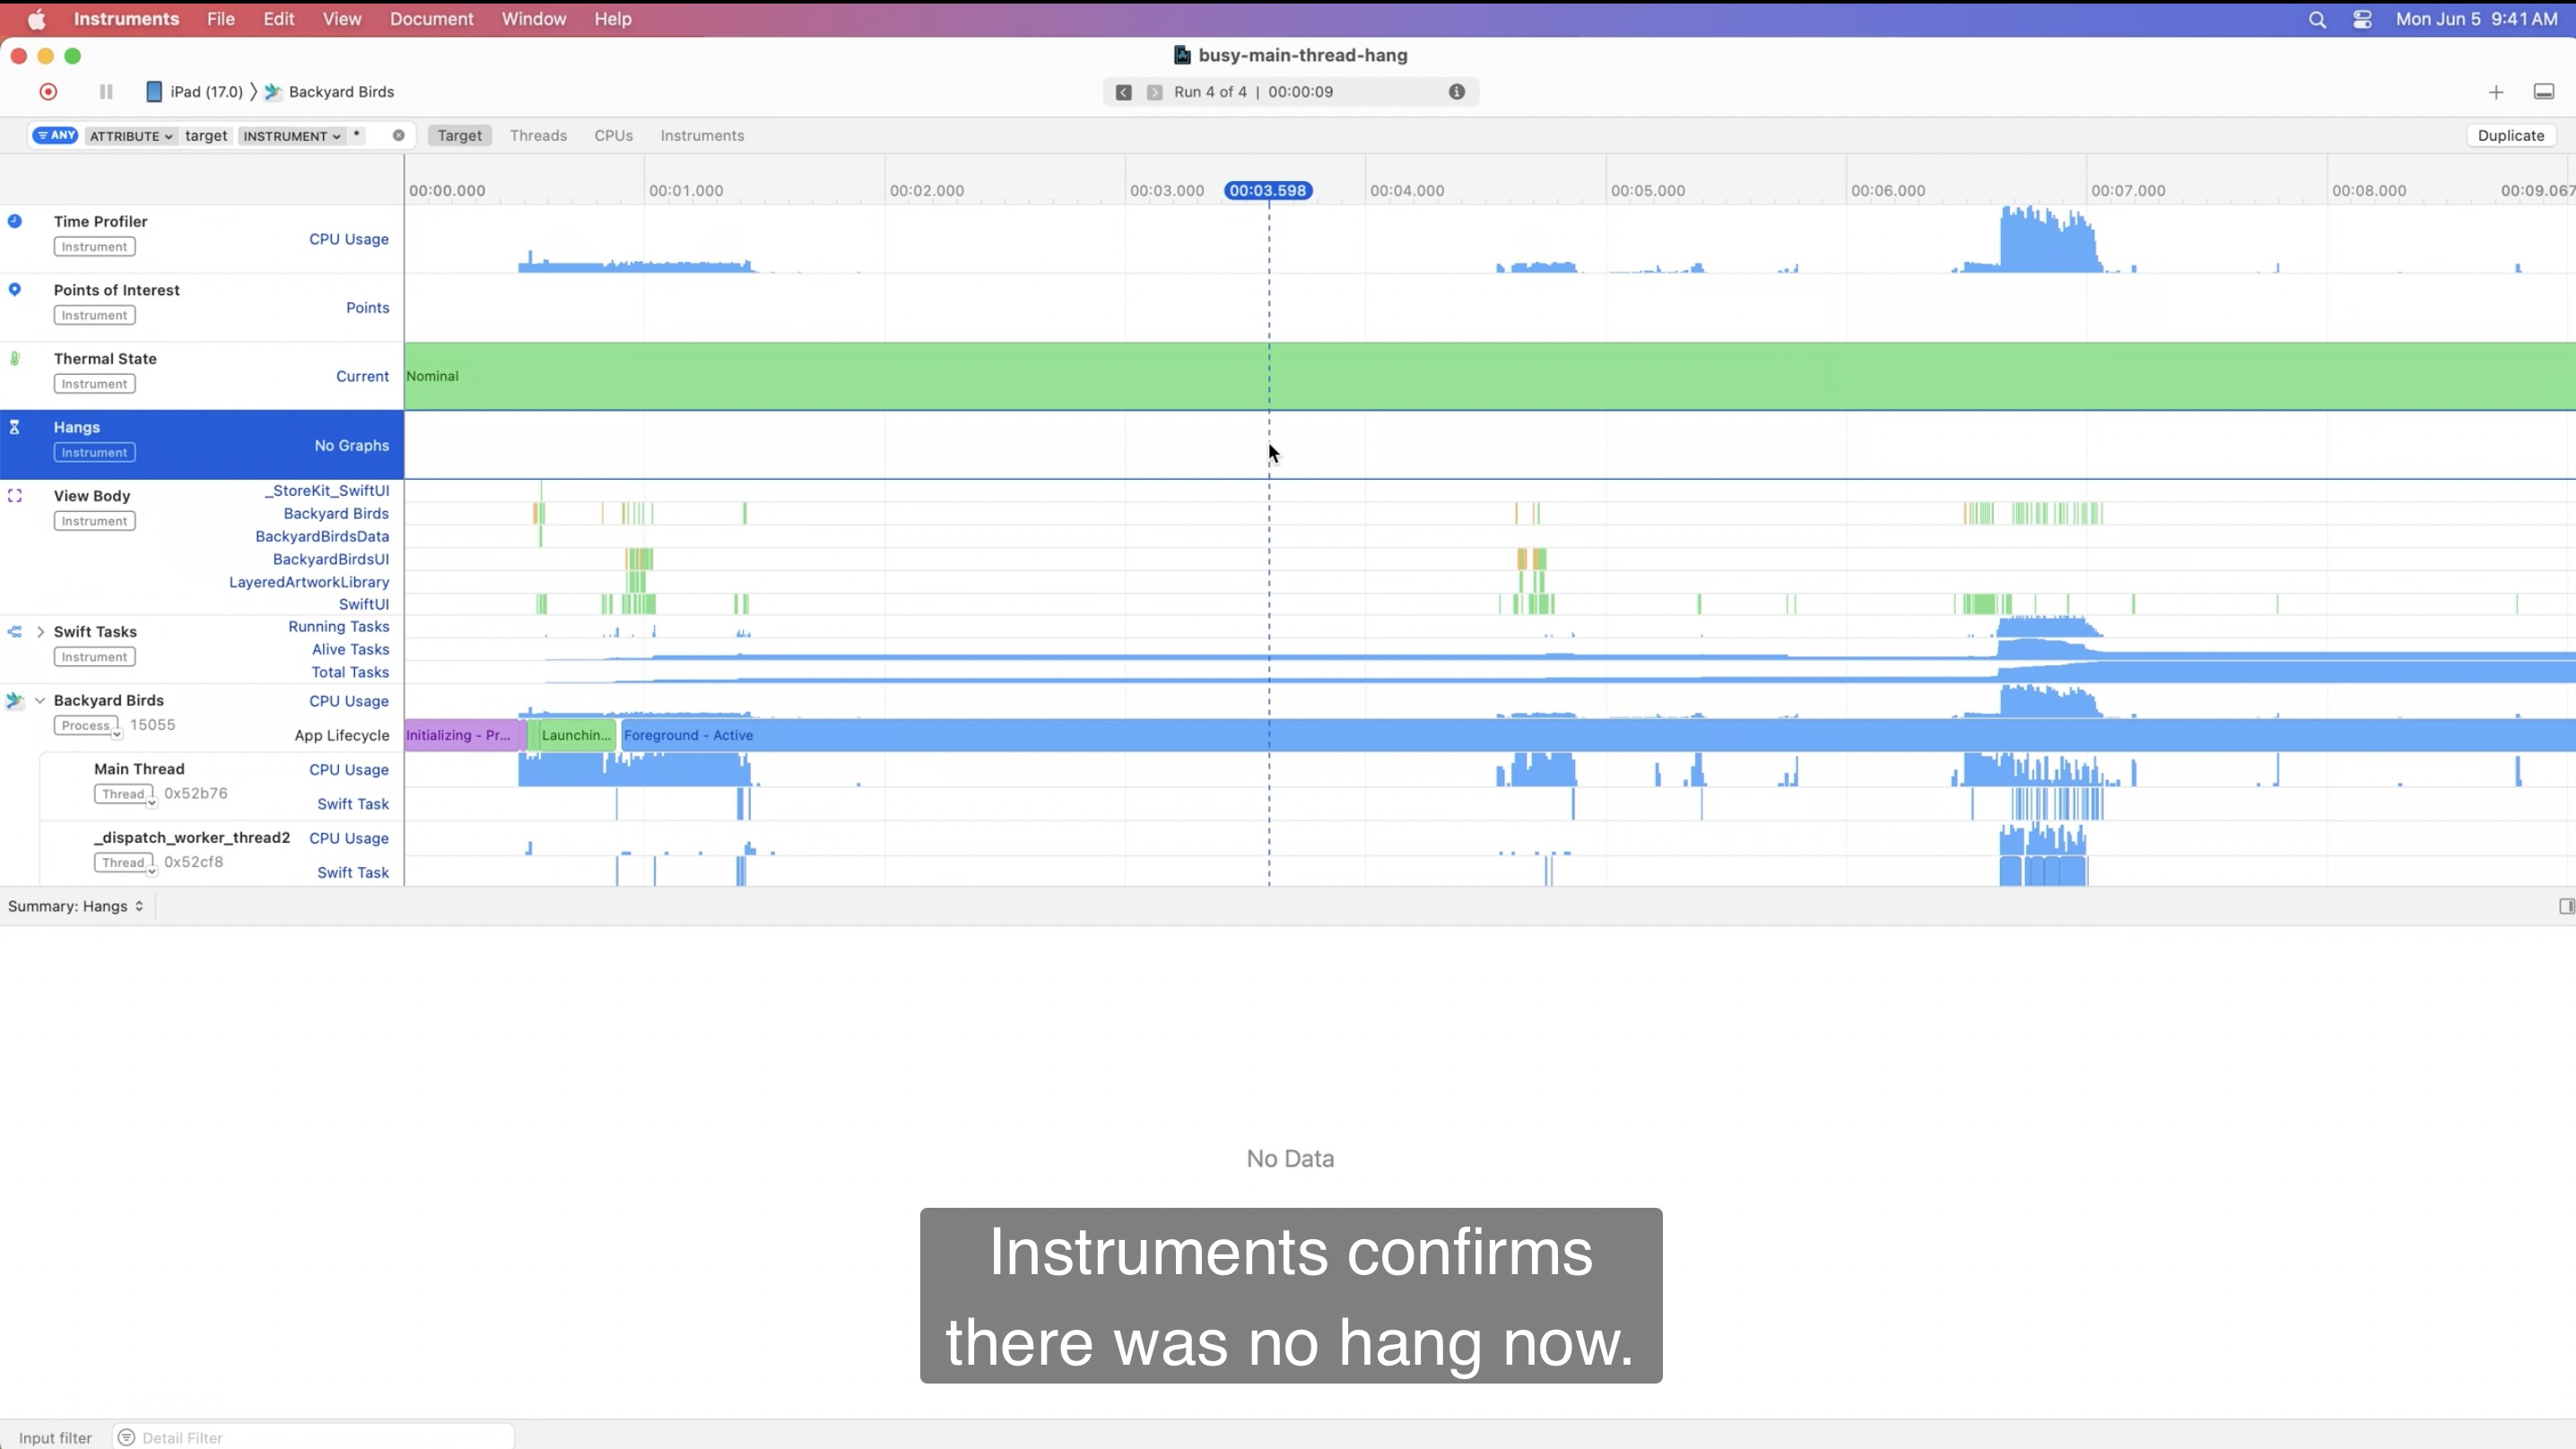
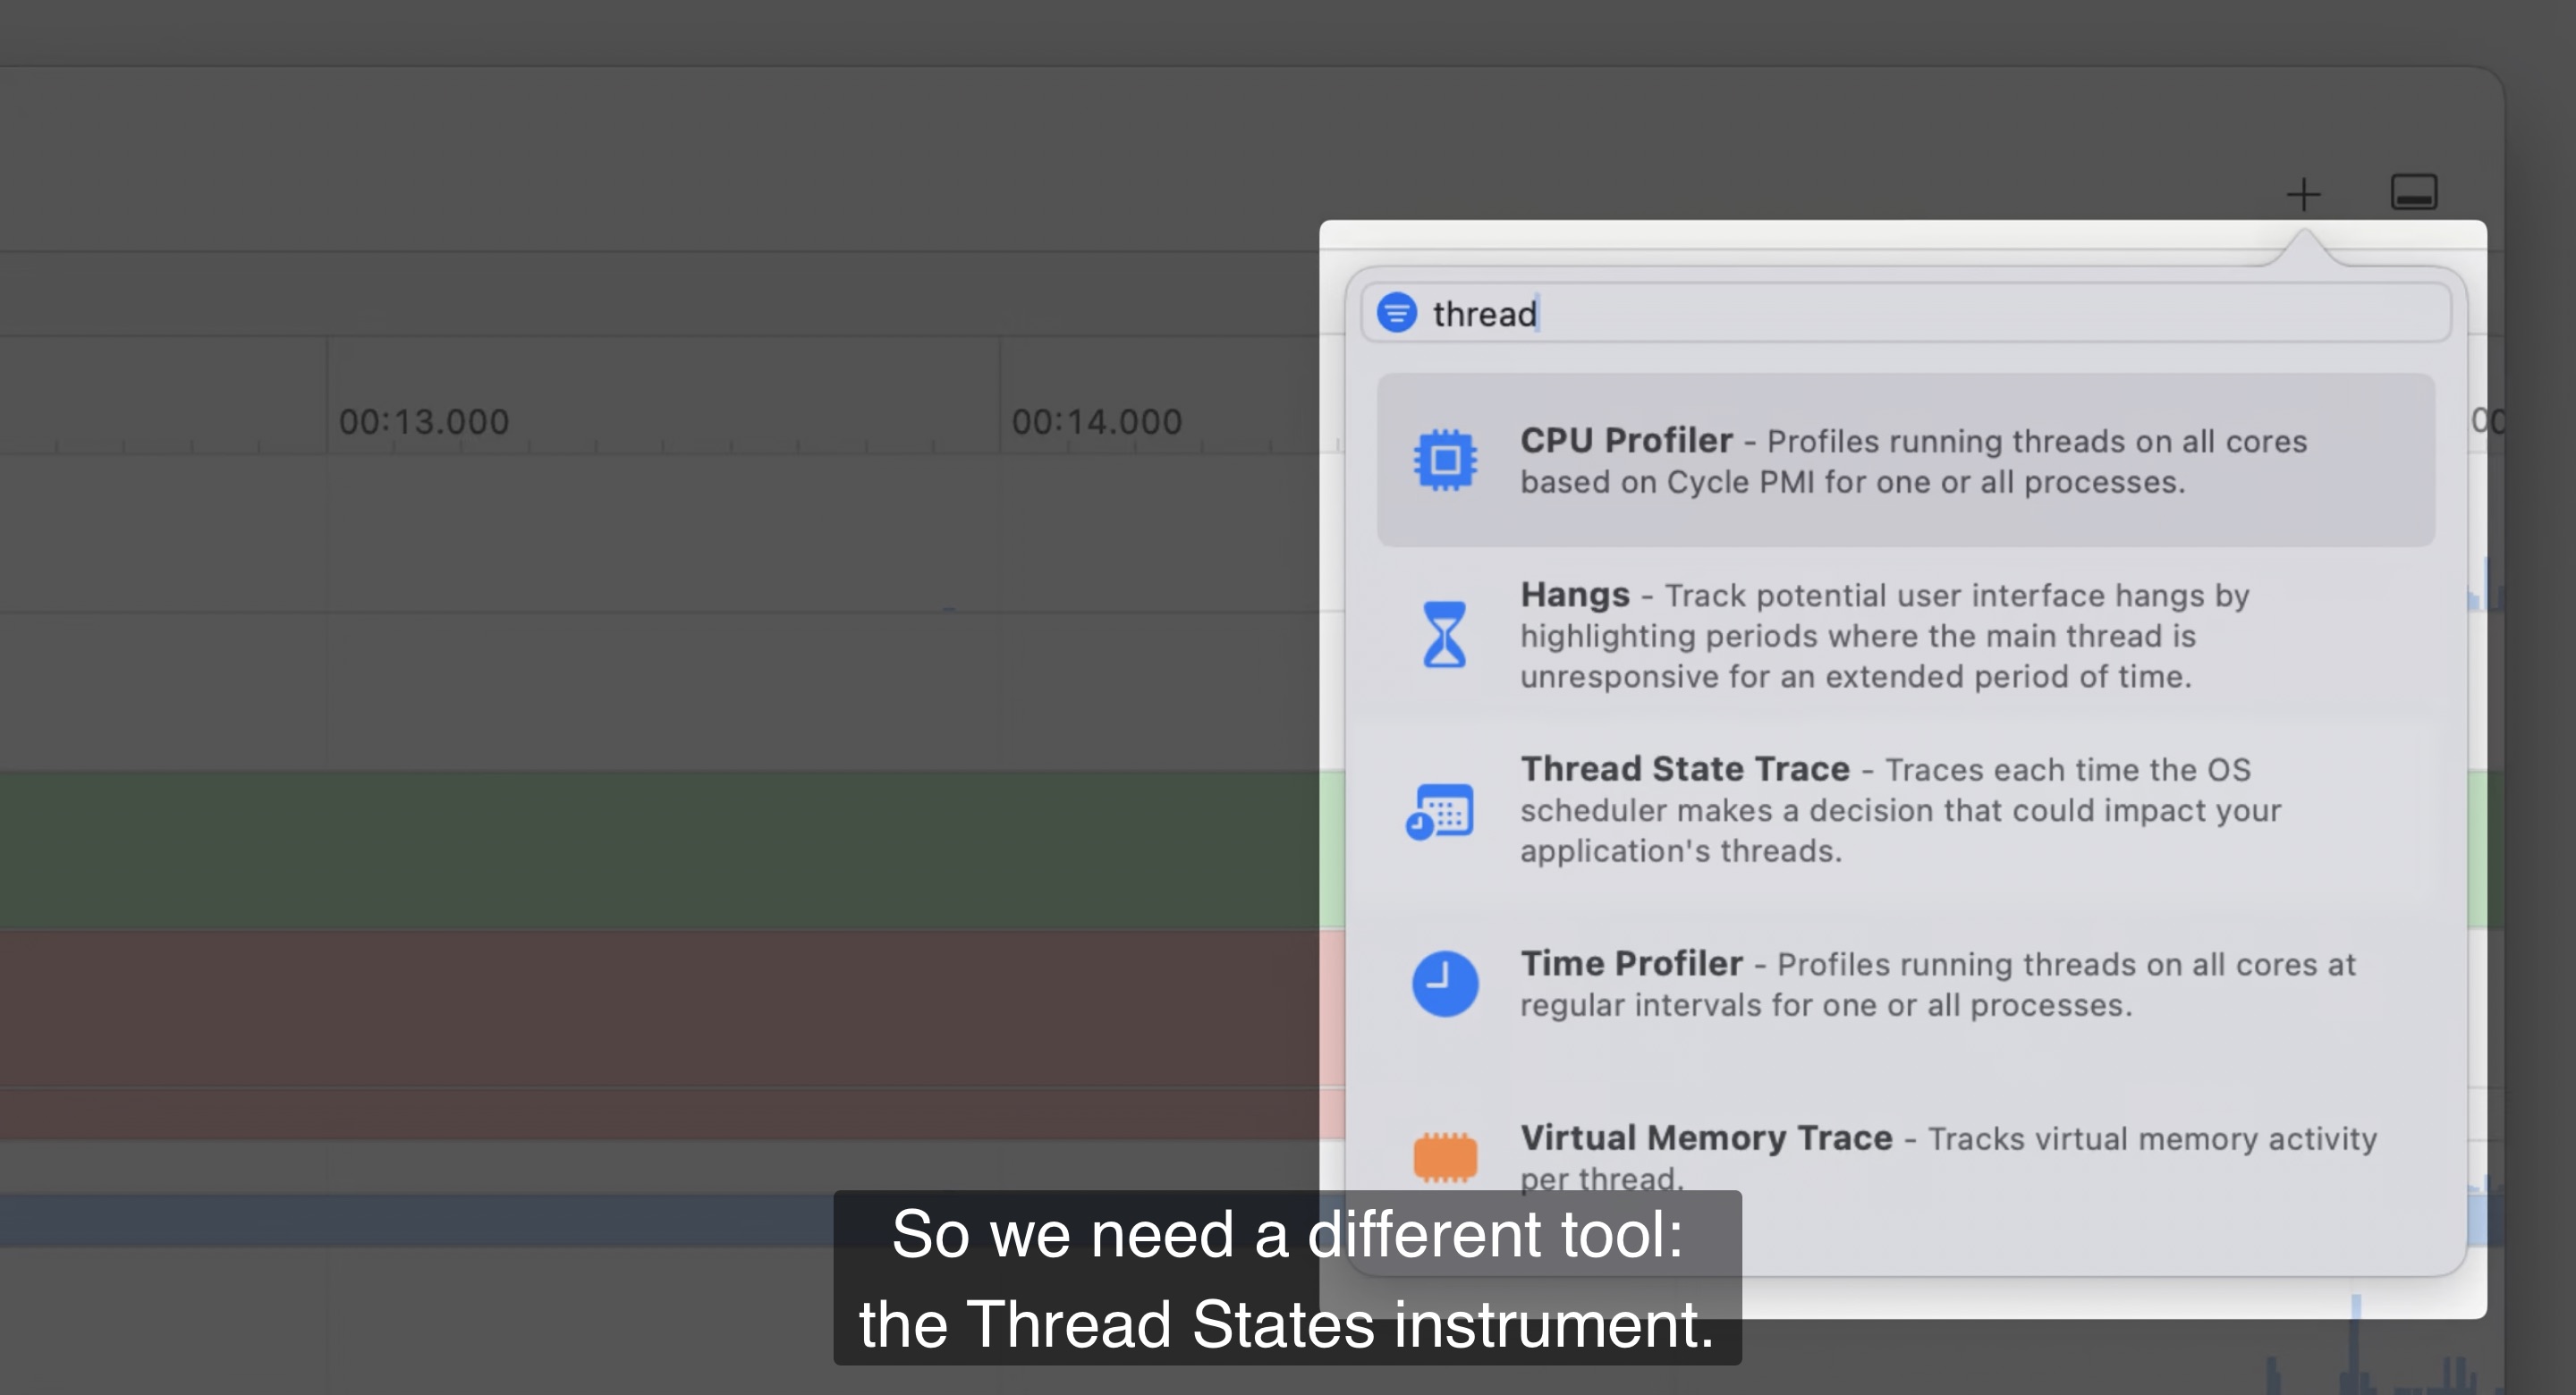
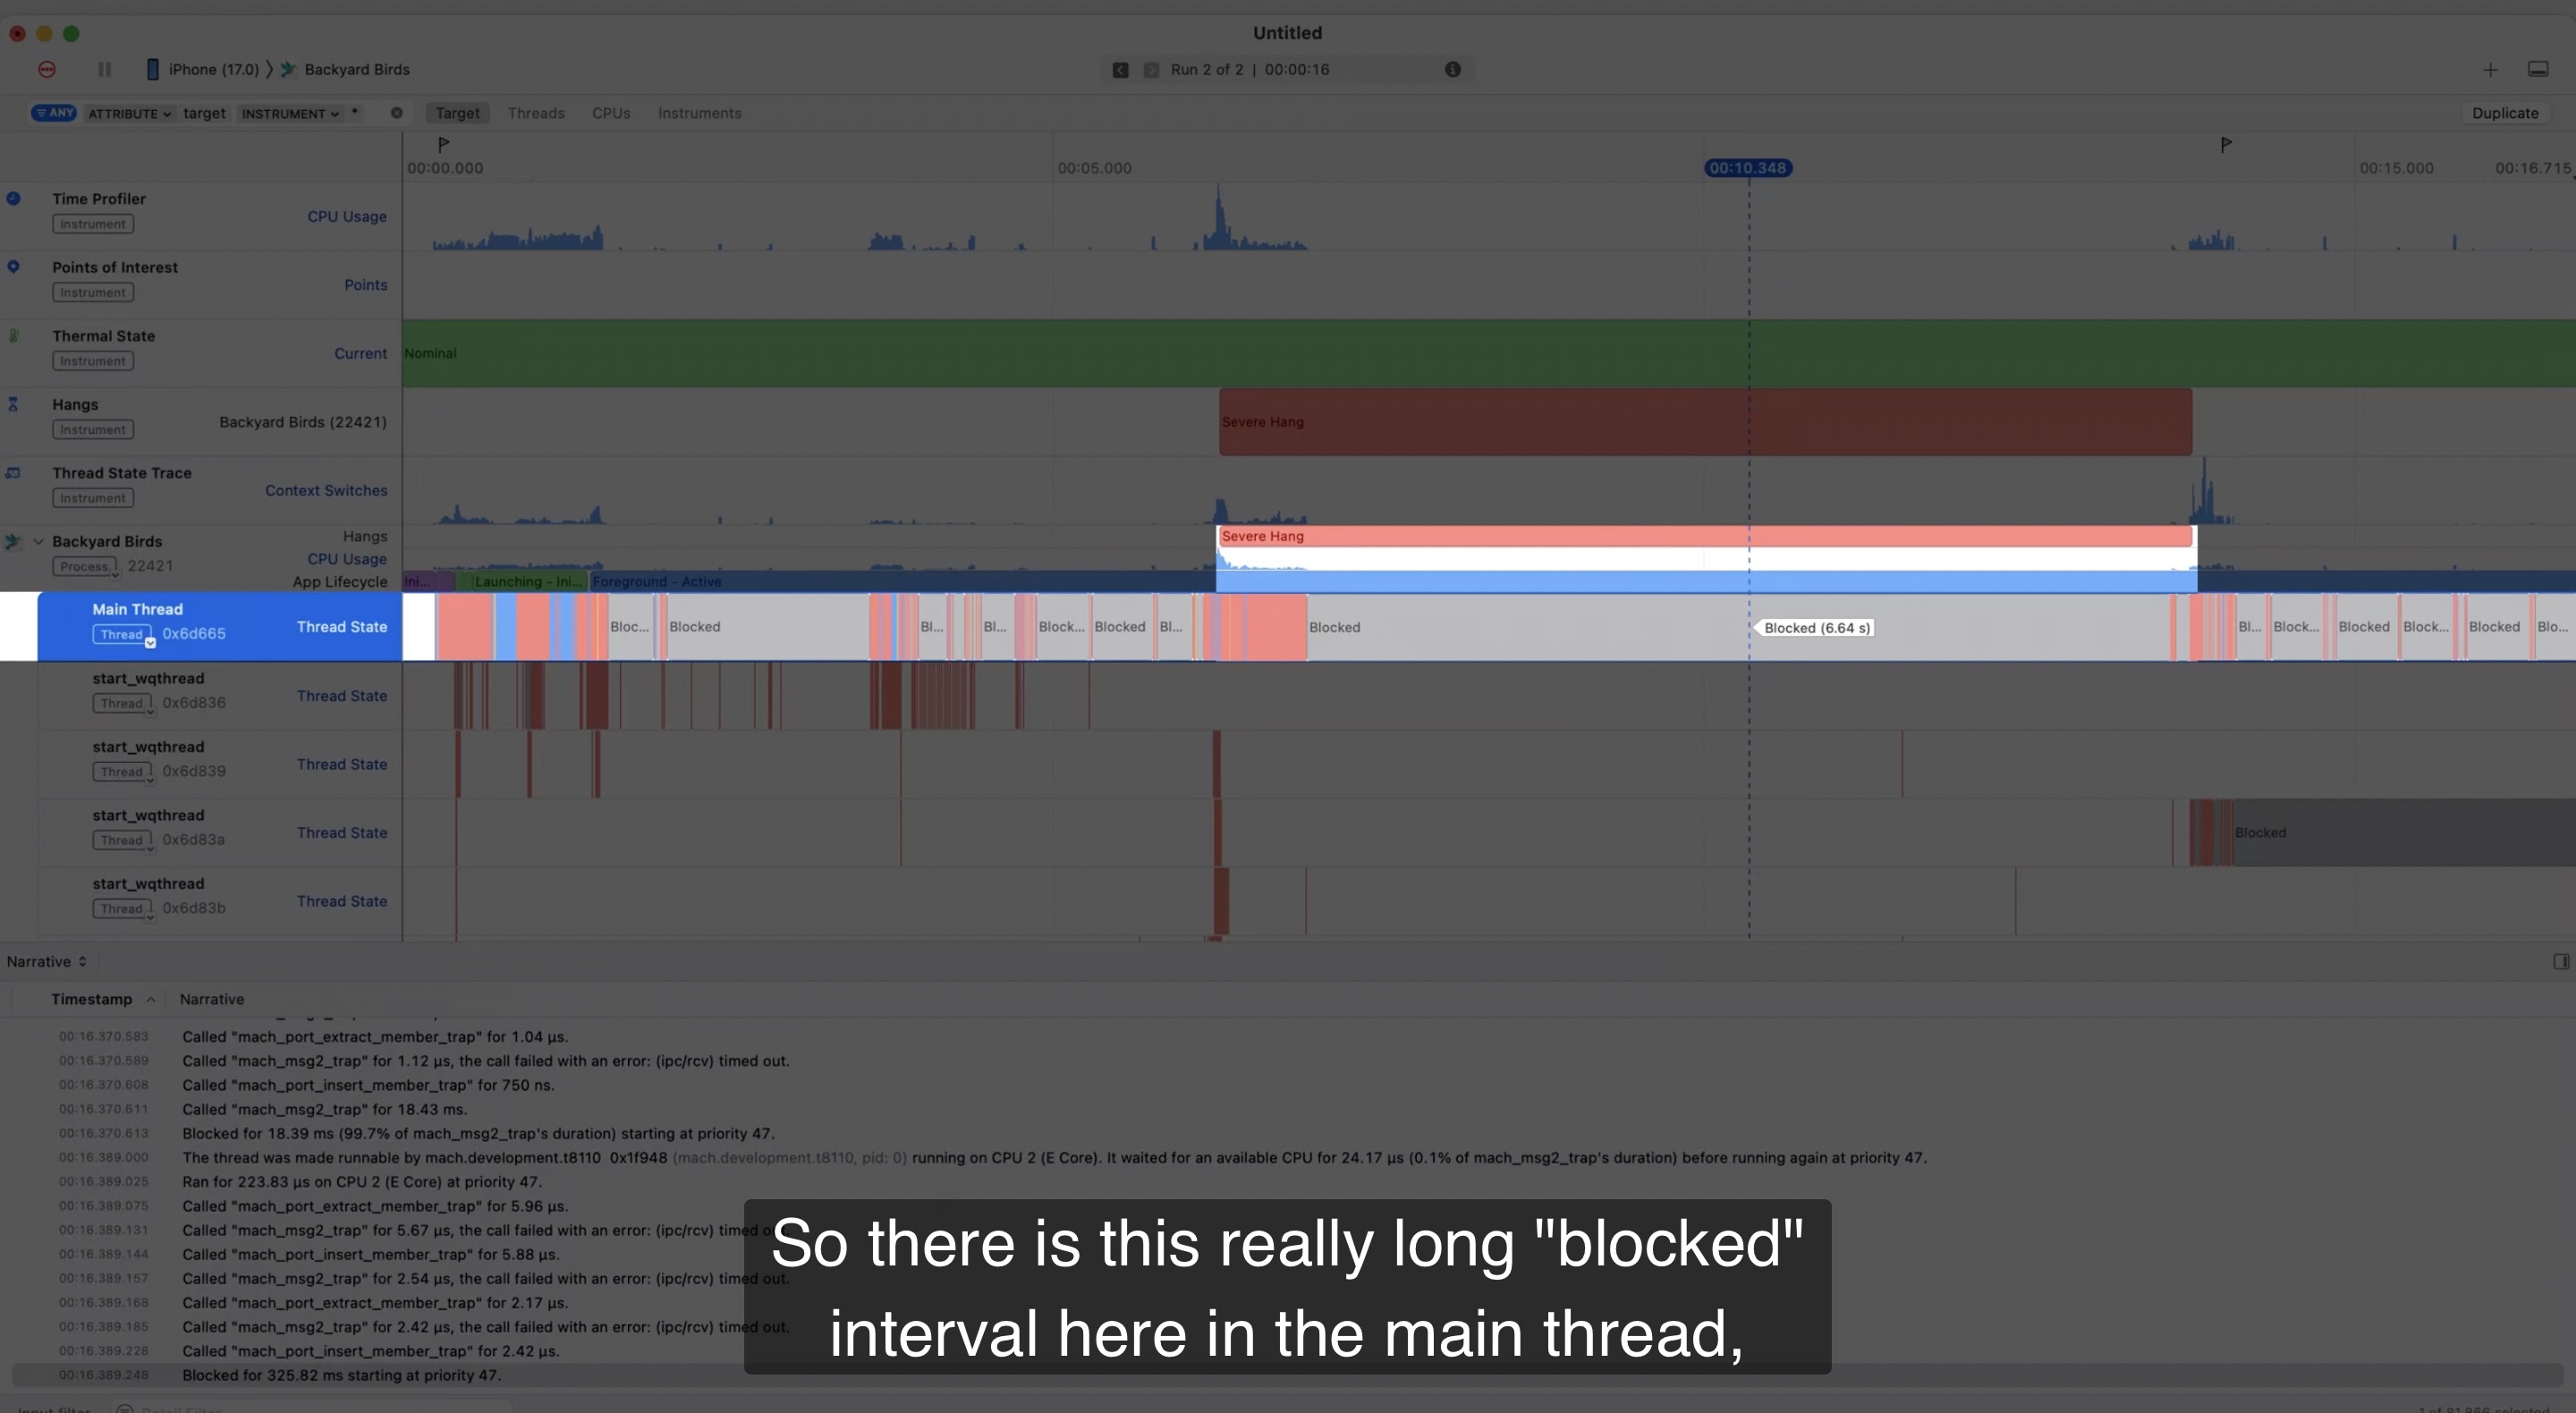
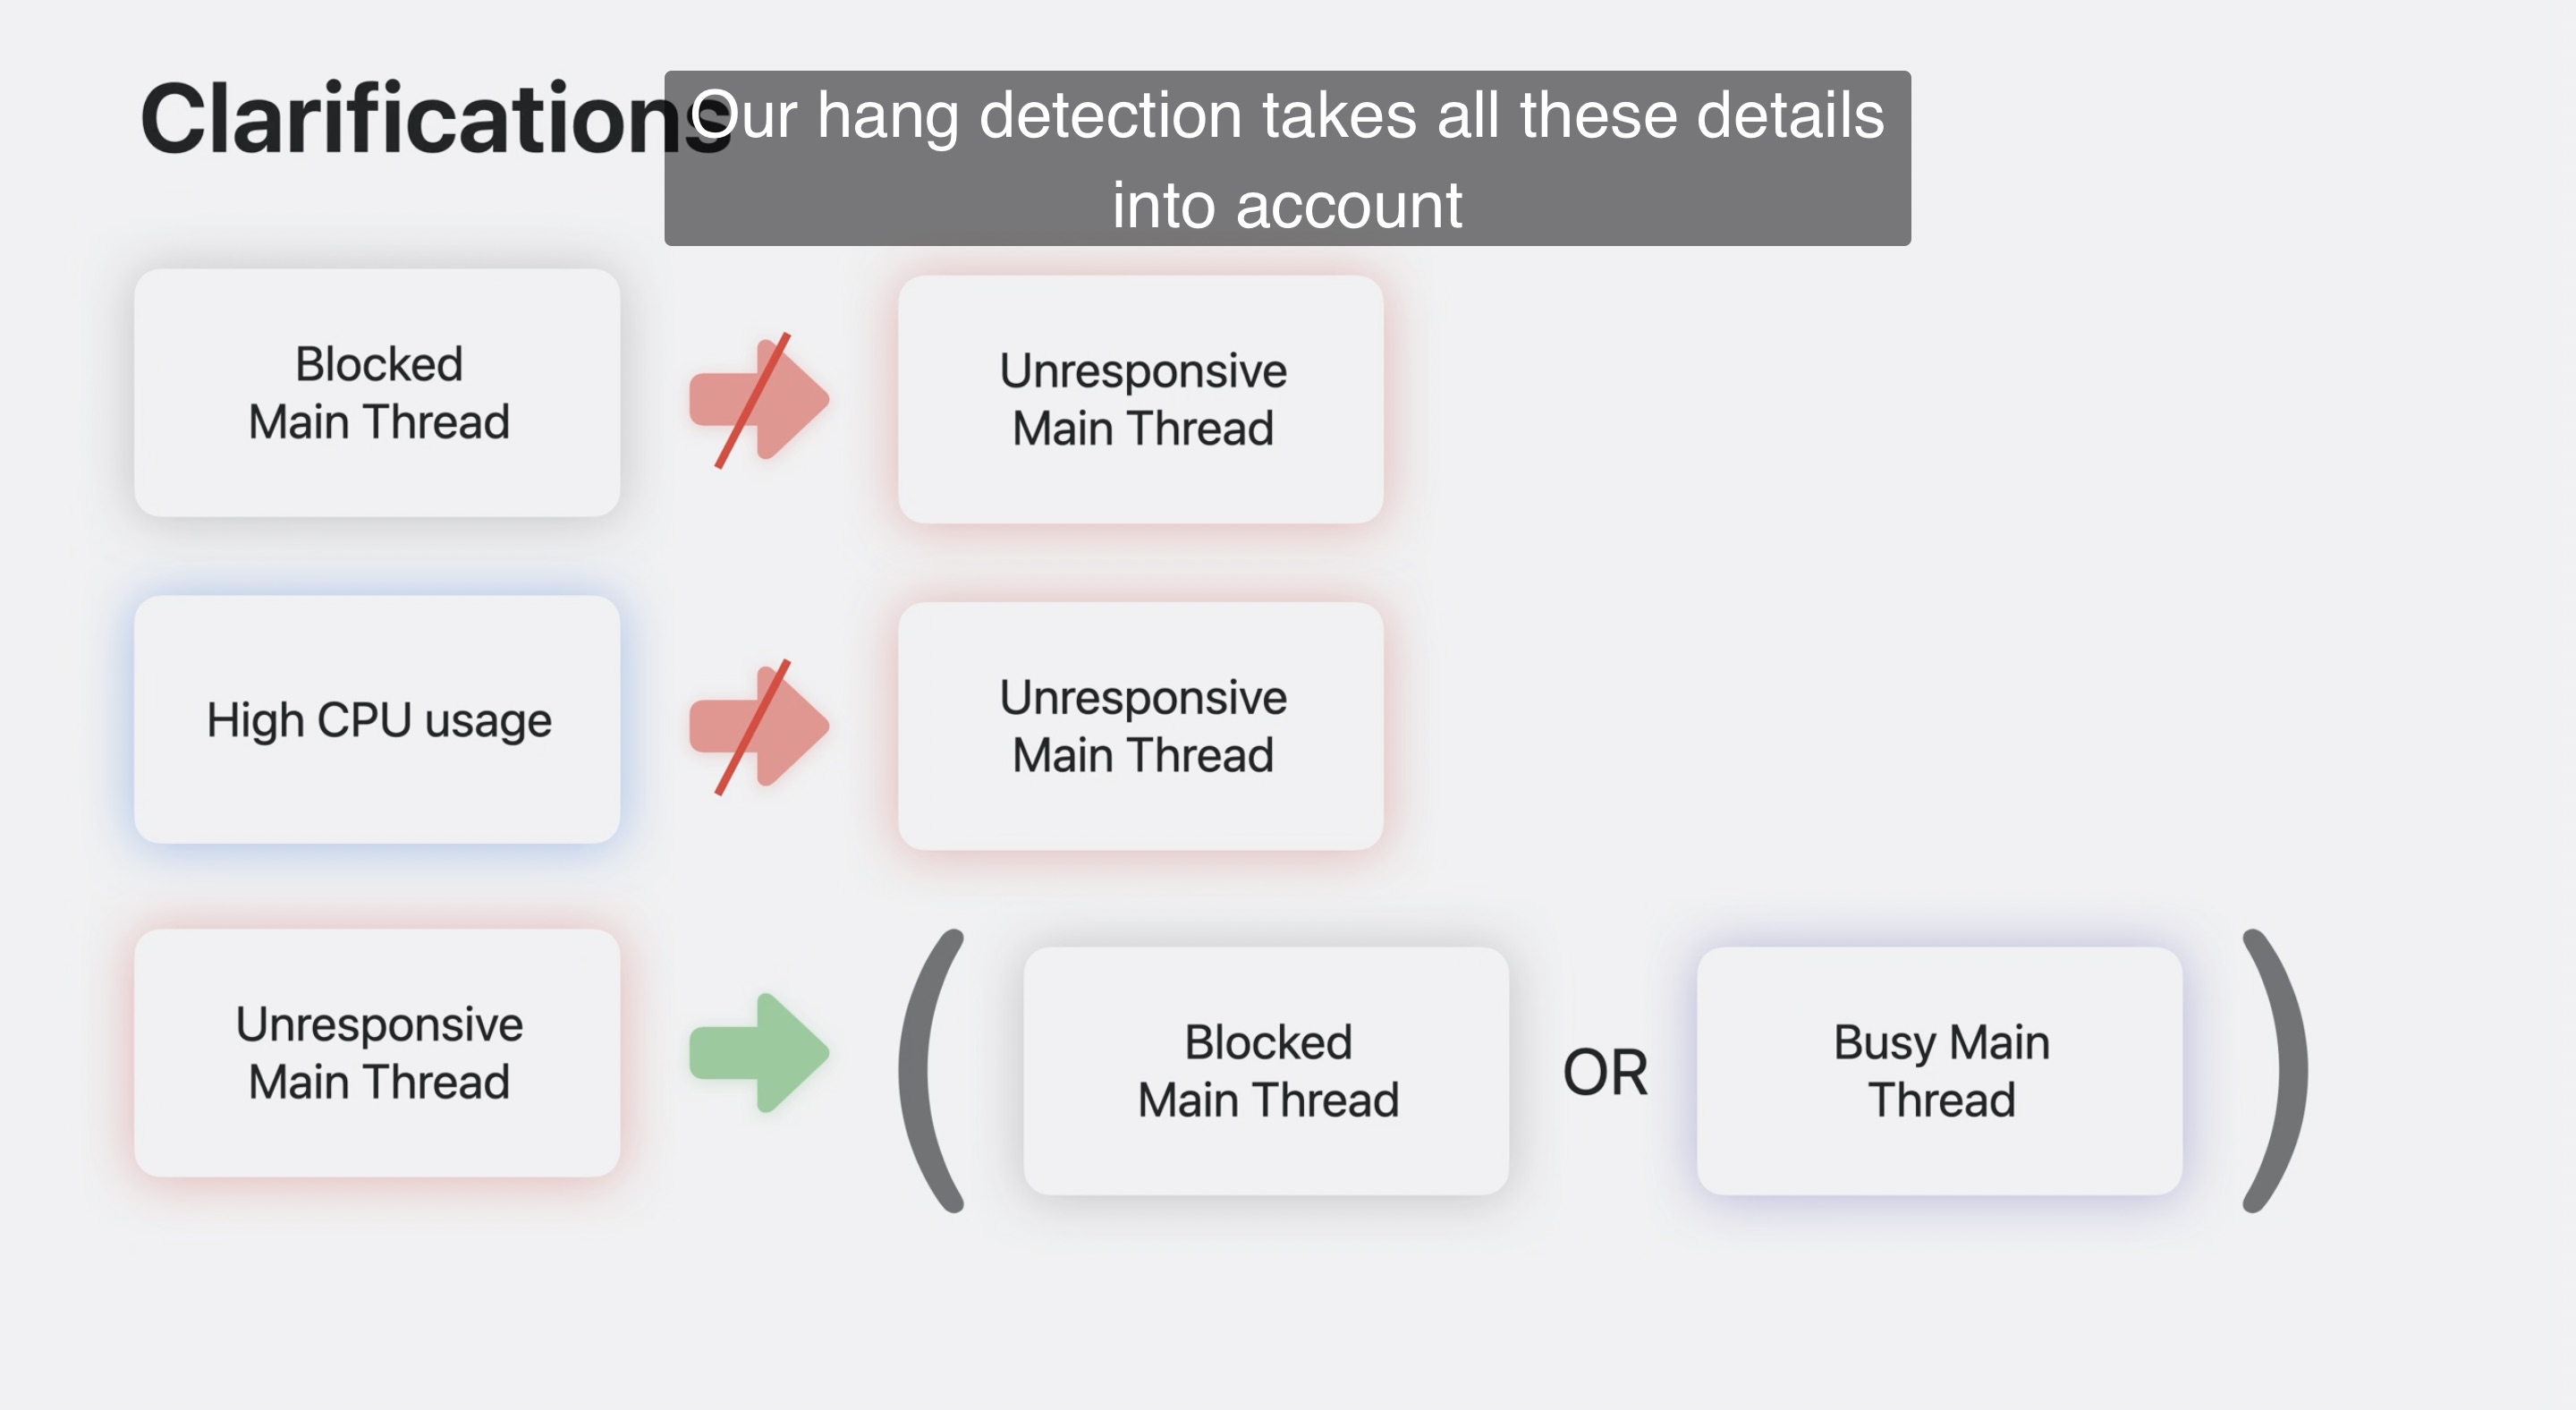
To determine whether a blocked thread is a responsiveness issue or not, look to the Hang instruments, not the thread states instruments. So a blocked main thread doesn’t imply an unresponsive main thread. High CPU usage also doesn’t imply that the main thread is unresponsive. If the main thread is unresponsive, that means it was either blocked or the main thread was busy.
Whatever work you are doing on the main thread, it should be done in less than 100ms to free the main thread for event handling again. The shorter the better. Determine whether the main thread is busy or blocked. Hangs can surface synchronously or asynchronously. Do less, move work to the background, sometimes, even both. measure first and check whether there is actually a hang before optimizing.
 Twitter
 GitHub
 linktr.ee