Debug with structured logging
 Roger Oba
Description: Discover the debug console in Xcode 15 and learn how you can improve your diagnostic experience through logging. Explore how you can navigate your logs easily and efficiently using advanced filtering and improved visualization. We'll also show you how to use the dwim-print command to evaluate expressions in your code while debugging.
What's new in the debug console
Now you can toggle metadata associated with the console output, making it a lot easier to visualize things urgency, category, and origin of the log message:
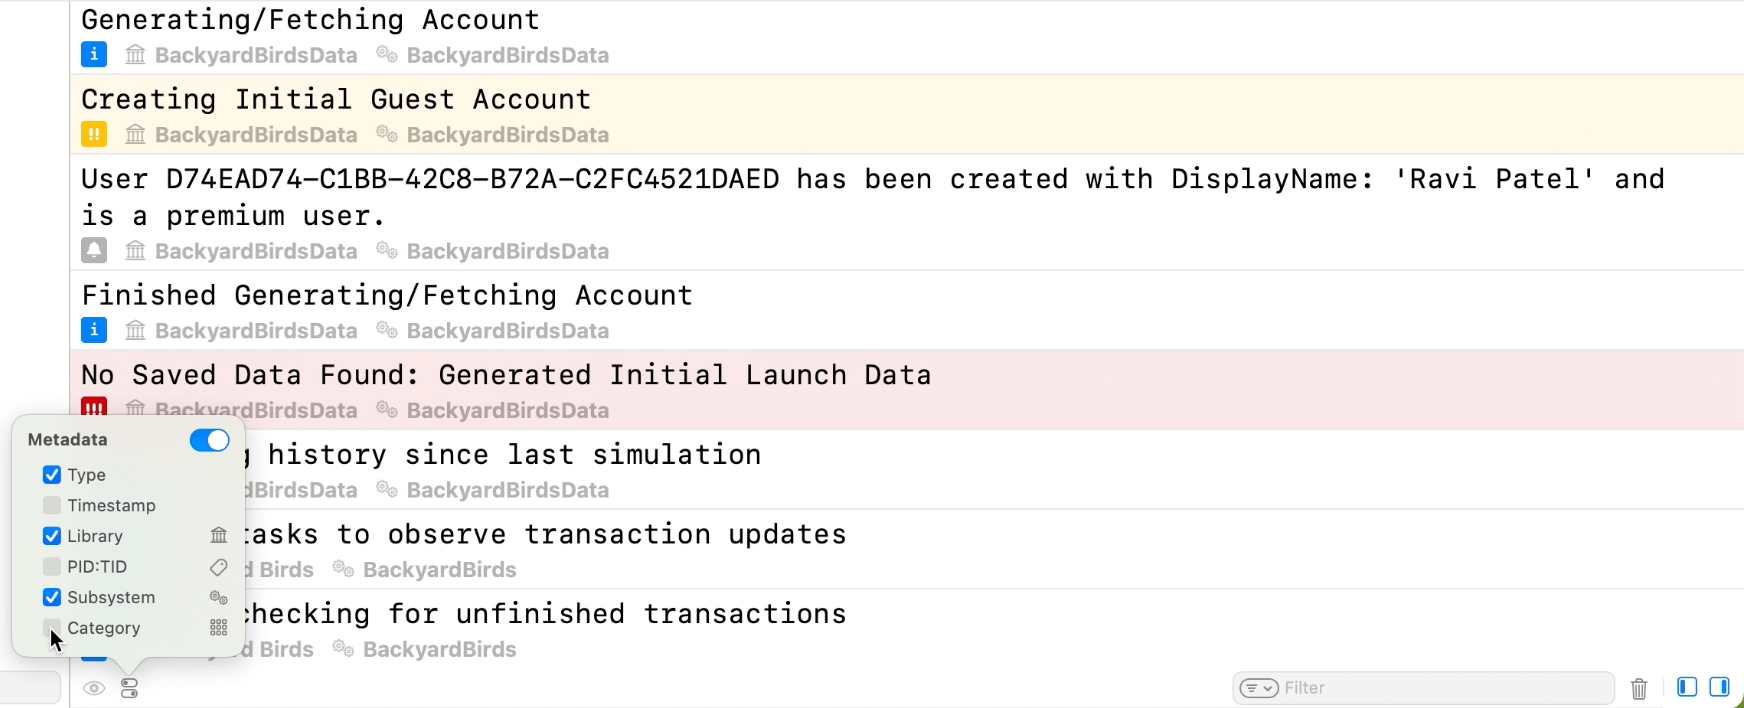
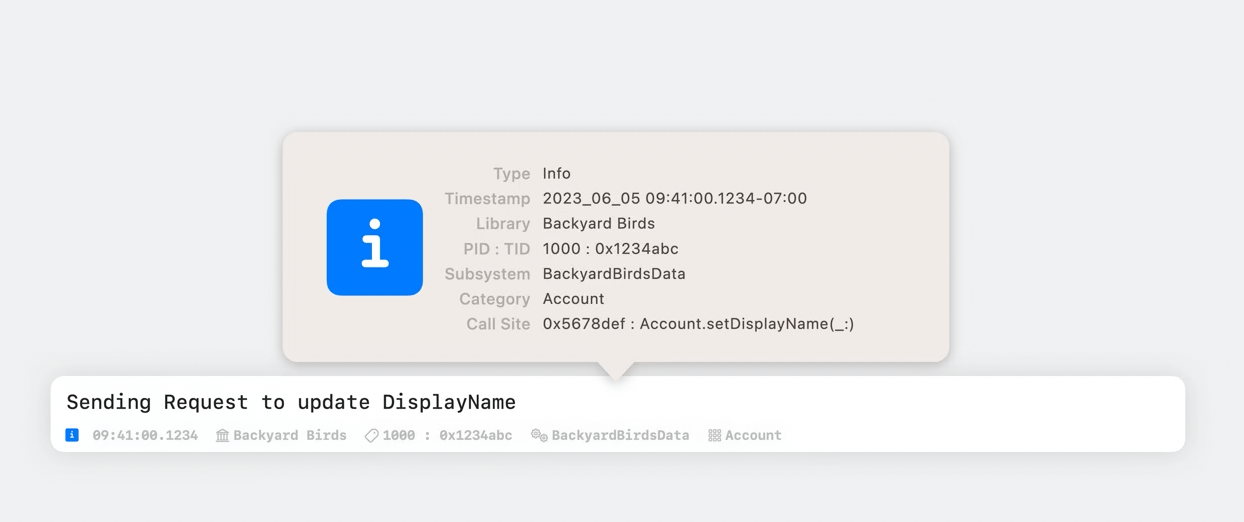
If you don't want to enable the metadata for all logs, you can quickly view the metadata of a single log line by pressing space on it:
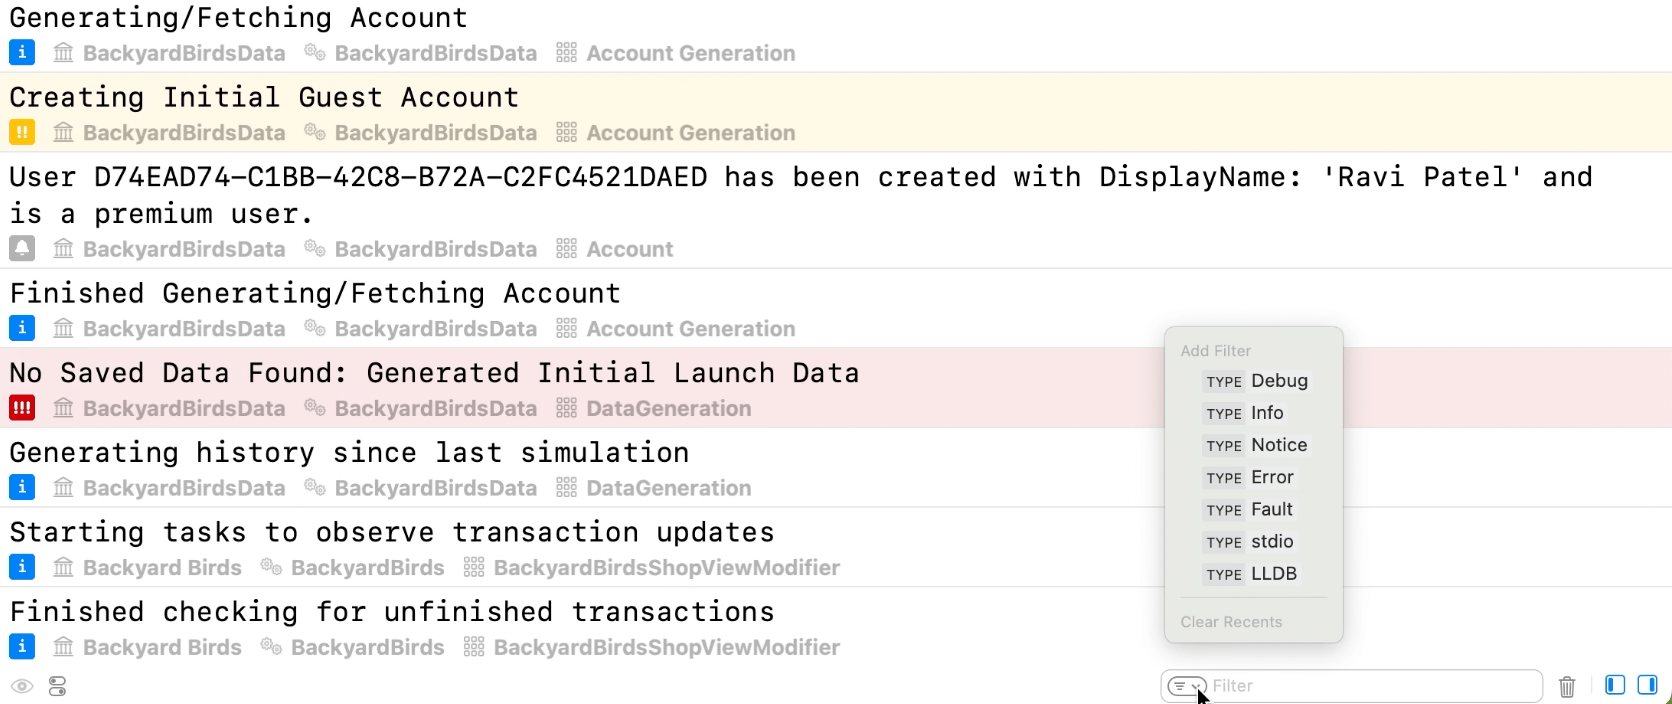
Filtering received great improvements as well, so your text-based searches can filter through the multiple types of metadata that Xcode collects, as well as toggle the visibility of different log types:
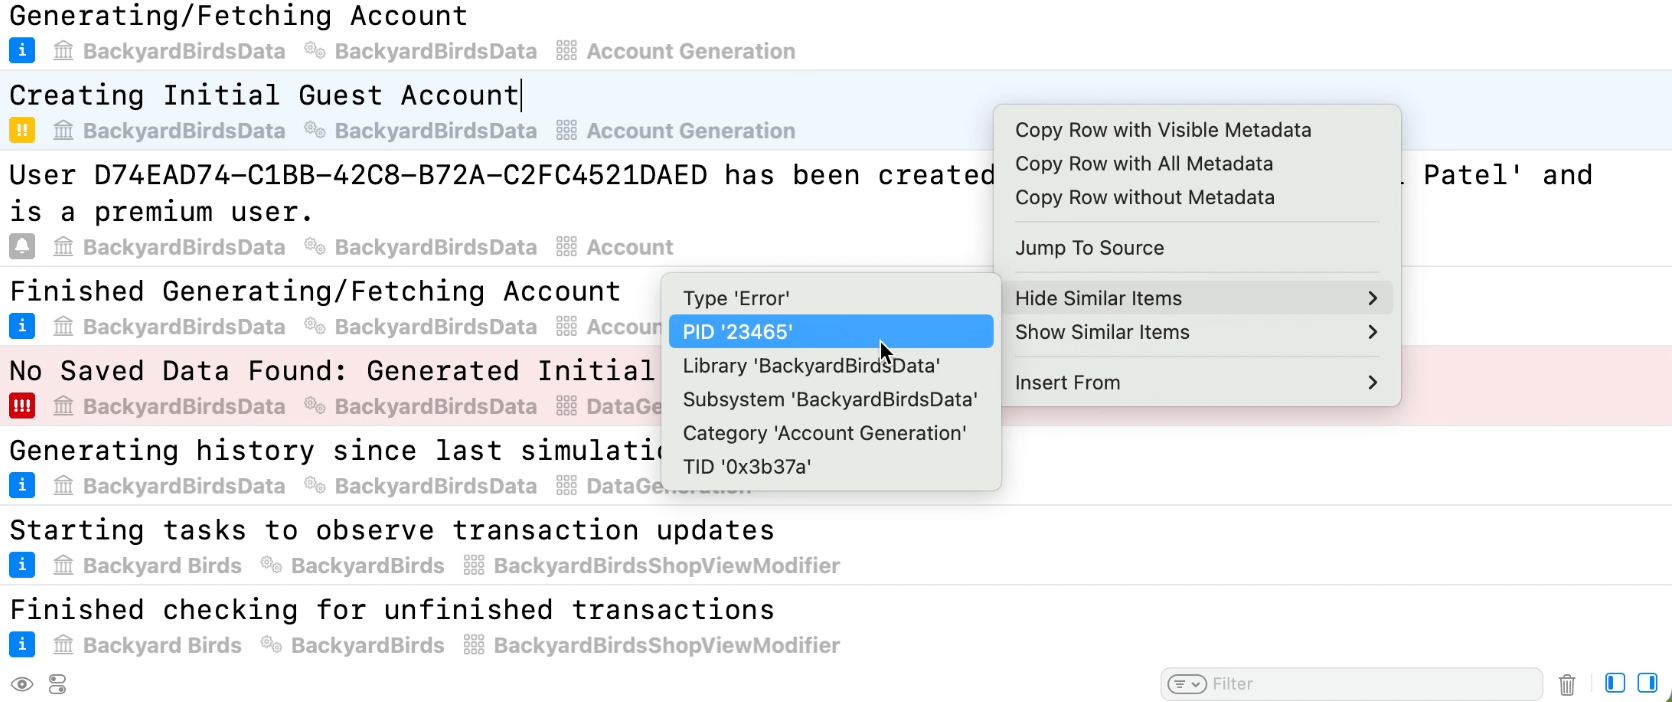
And you can also quickly show or hide similar items by right-clicking on a log:
By hovering the mouse over a log, you can also see the full path of the file that generated the log, and clicking on it will open the file in the editor.
LLDB improvements
Most of us simply use po whenever we want to debug anything in the console. This is often not the right command to use, as it can be a lot slower to perform than other simpler commands, and might not give what you want, e.g. by simply printing the memory address of the object, which's not helpful at all. There are other alternatives:
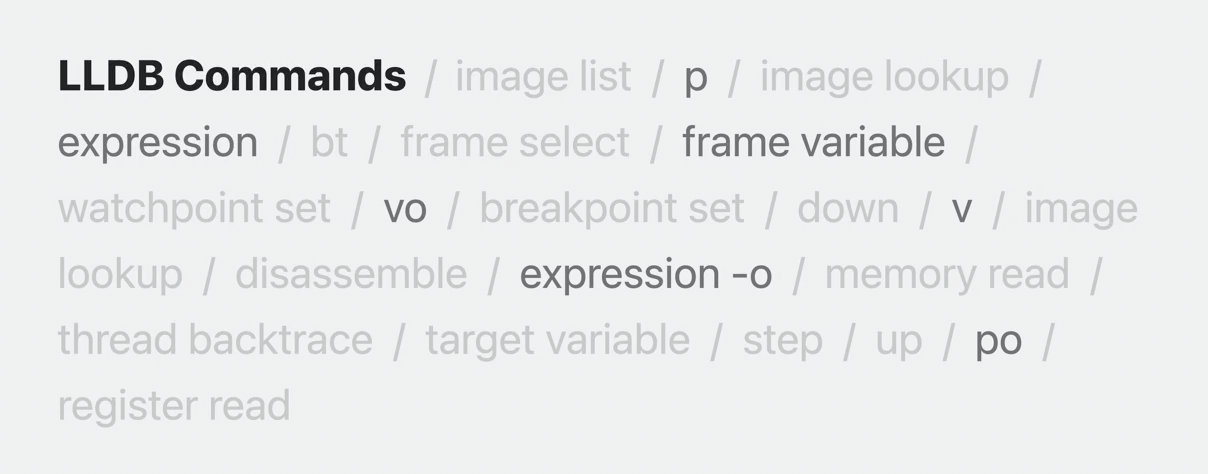
However, Apple has added a new command that can be used at all times and will generally do what you want, printing the best description possible of what you're trying to print. It's called Do What I Mean Print — dwim-print.
Since dwim-print is quite long and we don't want to be typing it all the time, they replaced the p and po aliases with this new smarter print command, so you can generally simply always just use p from now on 🎉
Tips for logging
Best practices reminder:
stdiois for command-line UIOSLogis for debugging
Therefore, print(…) should rarely be used to log events in your program's execution. Thus, move away from this:
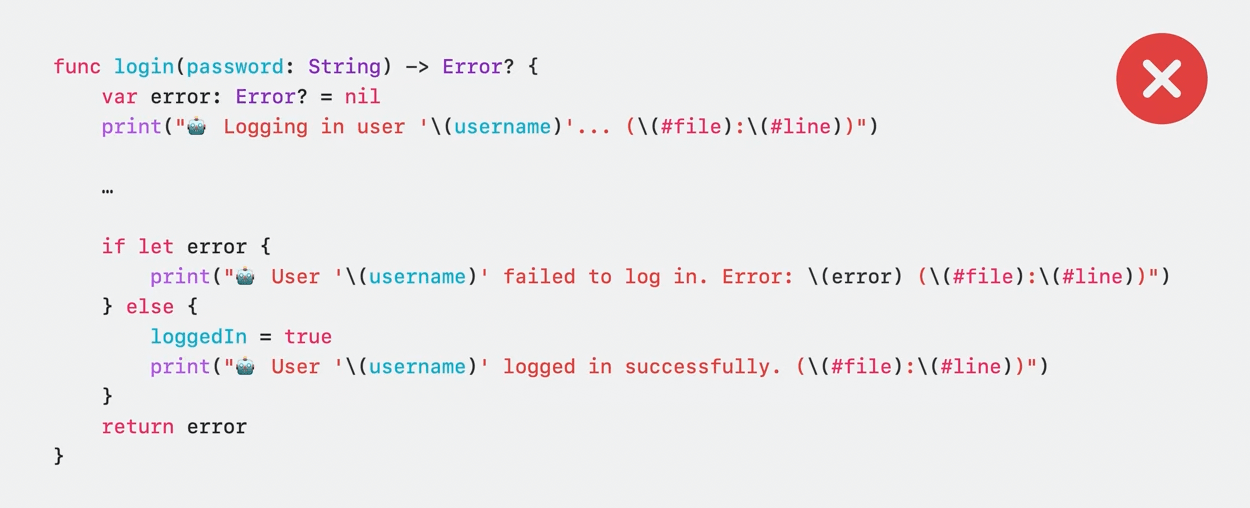
To this:
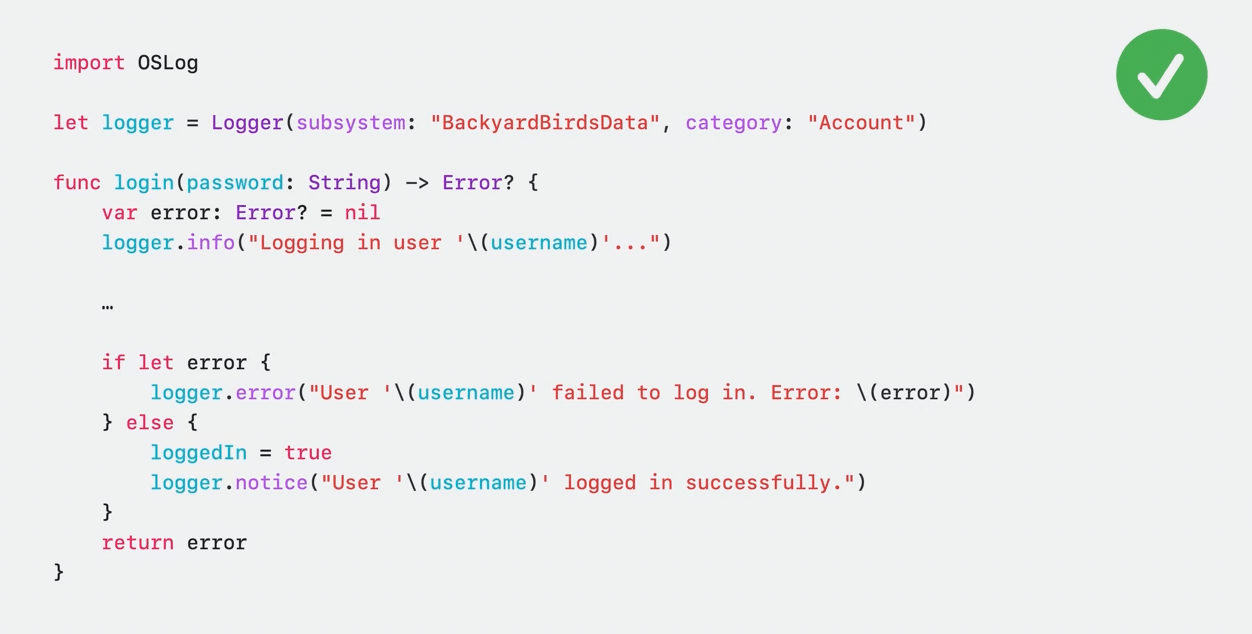
Finally, to get most out of your logging:
- Create multiple log handles, specific to each area of your application, to help you find the logs you're looking for.
- Take advantage of
OSLogStoreto collect valuable diagnostics when issues occur with your application in production. OSLogis a tracing facility. This means it is capable of providing you with complex performance analysis of your application using tools like Instruments.
 Twitter
 GitHub
 www.roger.ml