Explore pie charts and interactivity in Swift Charts
Written by
 Cihat Gündüz
Cihat Gündüz
Description: Swift Charts has come full circle: Get ready to bake up pie and donut charts in your app with the latest improvements to the framework. Learn how to make your charts scrollable, explore the chart selection API for revealing additional details in your data, and find out how enabling additional interactivity can make your charts even more delightful.
Pie Charts
- Pie charts do not have axes, they're: casual, intuitive, approachable
- New mark-based composition syntax type
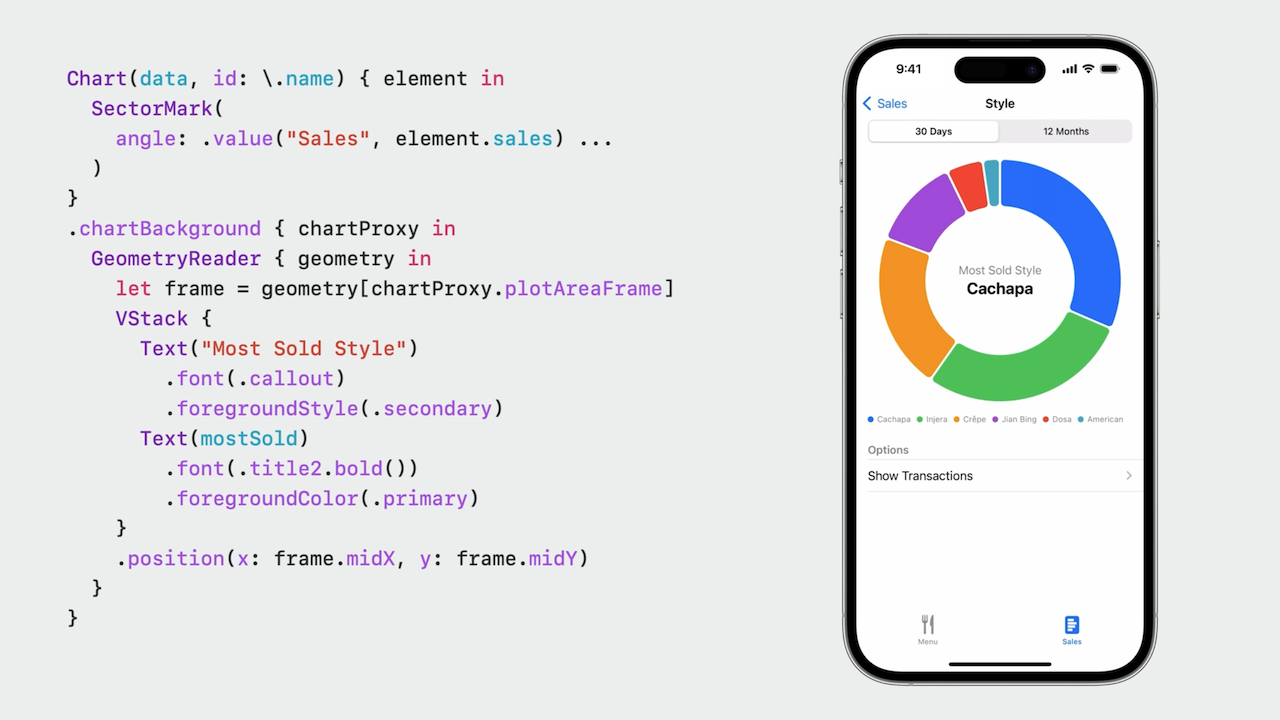
Sector Sectoris a Position in Polar Coordinate System, size proportional to the value- By increasing the inner radius, pie chart becomes a donut chart
- To migrate from a bar chart to a pie chart, change
BarMarktoSectorMark, and argumentx:to argumentangle: - Use
angularInset:param onSectorMarkto create space between pie pieces, supports also.cornerRadius - Set
innerRadius:param onSectorMarkto a.ratiovalue to turn into donut chart (e.g. golden ratio0.618) - You can put text inside a donut chart by using
.chartBackgroundwhich usesGeometryReader
Selection
- Use
chartXSelection(value: $selectedValueto store selected value to a@Binding var selectedValue: Value? - Use
if let selectedValue {to define aRuleMarkwhen the value is non-nil to show selection in chart - Use
.annotationmodifier on theRuleMarkto create a popover that shows additional details about the selection - Use
.overflowResolutionparam of.annotationand sety: .disabledto extend the annotation outside the chart view
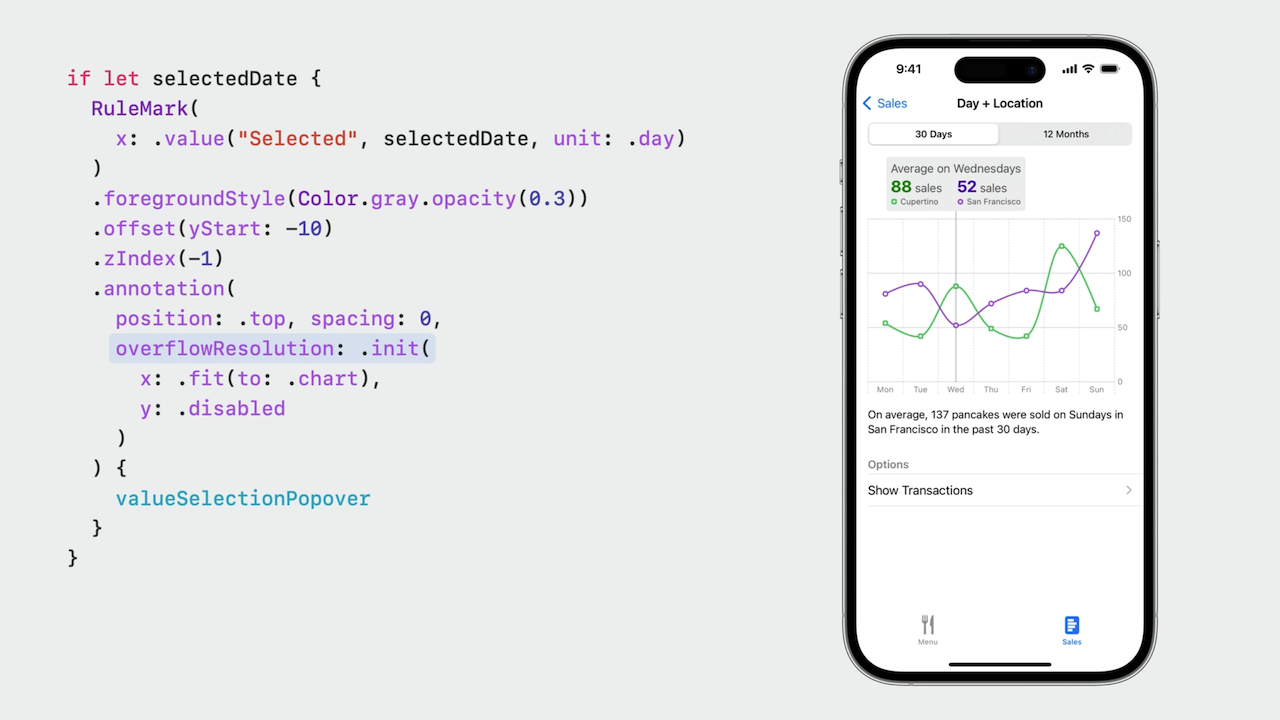
- A variant of
.chartXSelectionwith argumentrangeallows to select a range of values (default: two finger tap on iOS, drag on macOS) - Use
.chartGestureto define a custom gesture for value/range selection
Scrolling
- Enable scrolling via
.chartScrollableAxes(.horizontal|.vertical) - Define scrolling range using
.chartXVisibleDomain(length:) - Store current scroll position in Binding using
chartScrollPosition(x: $scrollPosition) chartScrollTargetBehavior(.valueAligned(matching:majorAlignment:)allows "snapping" to specific values if needed- More on scrolling in session Beyond Scroll Views
 Twitter
 GitHub
 fline.dev