Analyze HTTP traffic in Instruments
Written by
 Michael Abadi Santoso
Michael Abadi Santoso
Description: Learn to use the Instruments Network template to record and analyze your app's HTTP traffic. We'll show you how to explore and visualize the behavior of sessions, tasks, and individual HTTP requests to ensure data is transmitted efficiently and respects people's privacy.
Track hierarchy
- HTTP Traffic instruments
- Number of active tasks
- Process
- Debuggable process and background tasks daemon
- Session
- One track per
URLSessionobject - Individual task intervals
- Configurable session name:
- One track per
let session = URLSession(configuration: .default)
session.sessionDescription = "Main Session"
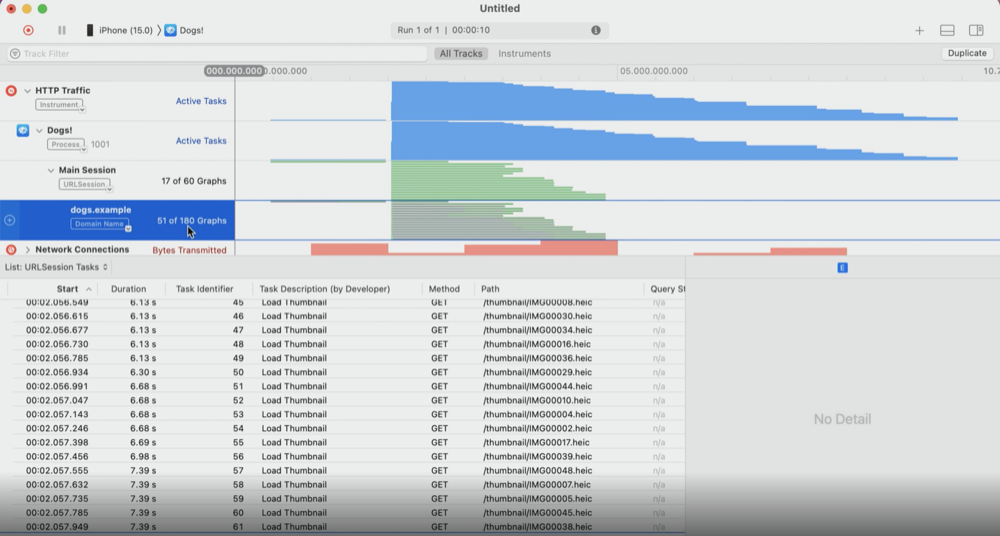
- Domain
- Only task that requested in the domain
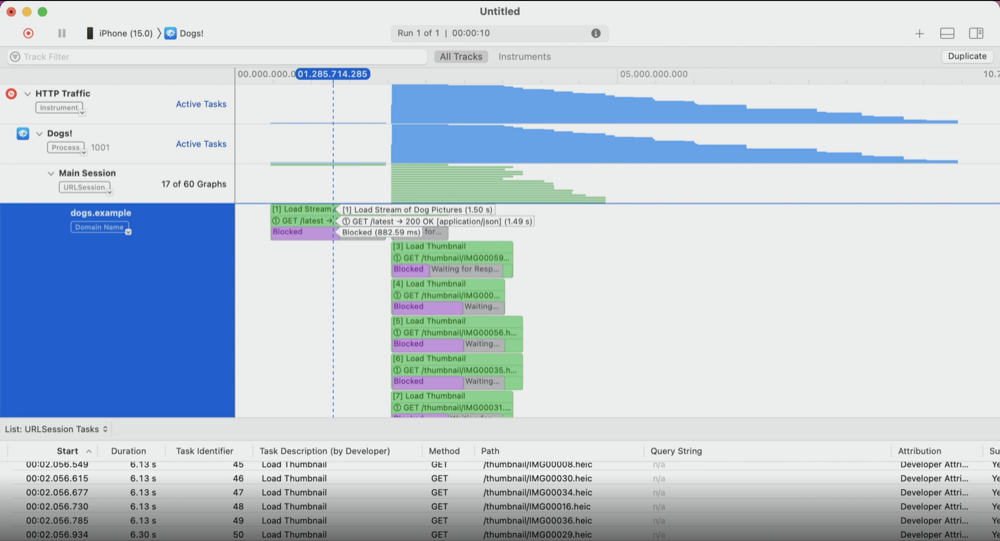
- More detail about tasks
- Individual transactions
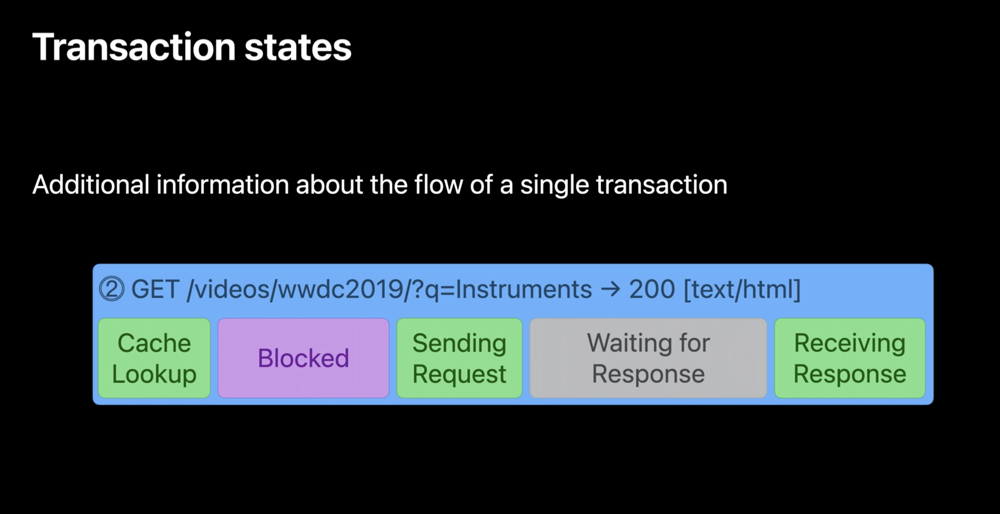
- Transaction states
Task timing
- Structural timing from start till the end
let task = session.dataTask(with: url) {
  /* handle result */ // 👈🏻 Complete event triggers here
}

task.resume() // 👈🏻 Resume event triggers here
Task Identifier
- Ability to read the task identifier for clarity
let task = session.dataTask(with: url) {
  /* handle result */
}
task.taskDescription = "Load Thumbnail"
task.resume()
task.taskIdentifier // 👈🏻 this identifier will be shown in instruments
Task Error
- Ability to distinguish error and success with color
Transactions
- Request + response pair being handled by the URL Loading system
- Contains all the HTTP Layer information
- URL, Http version, connection, cache info
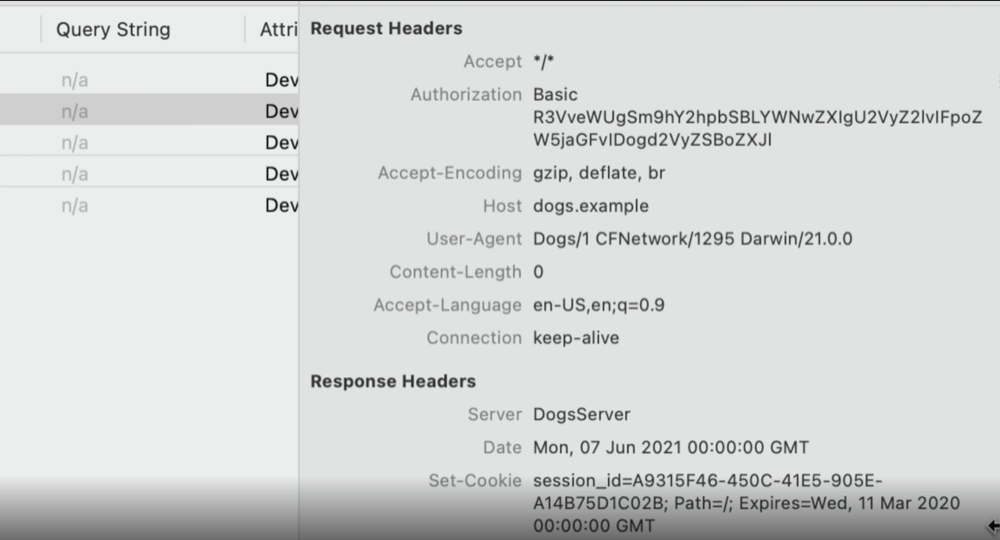
- Request + Response header
- Request + Response body
- And more
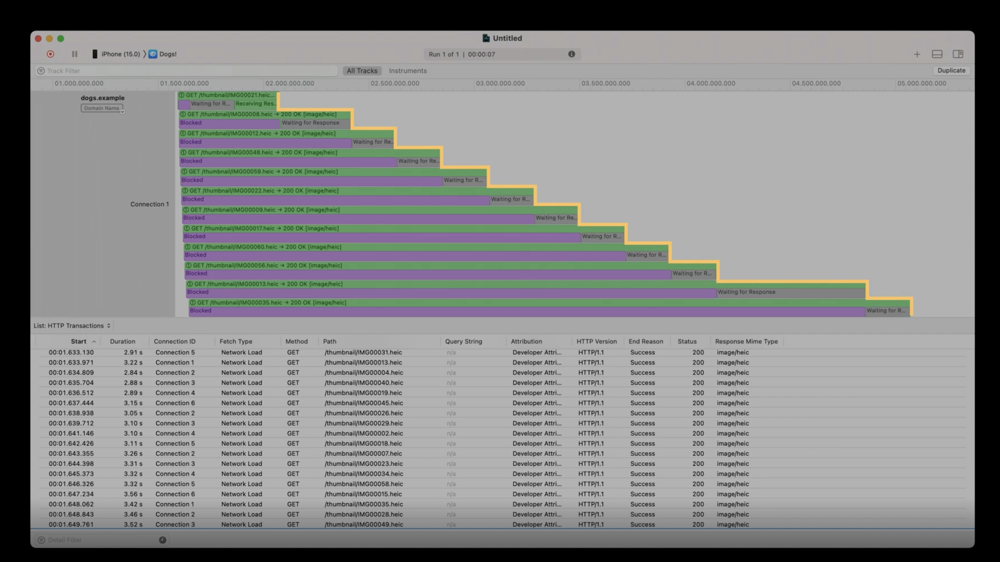
Transaction states
- Multiple states to add information for distinction between each block
Instrument
- Focus on the task description
- Expand the task description
- Filter by connection
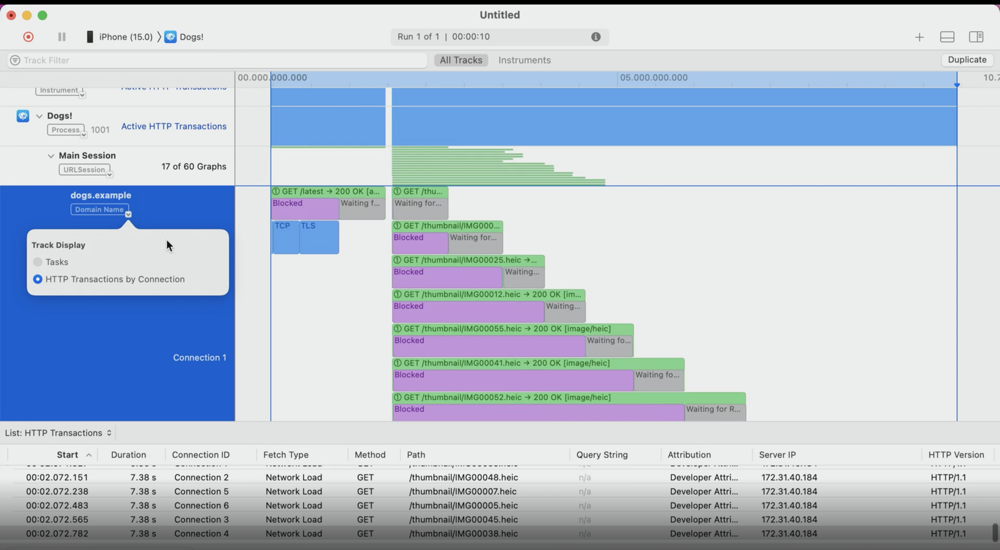
- Identify the http task issues (Ex: Staircase problem)
- Identify the request (Ex: wrong expiration date of cookie)
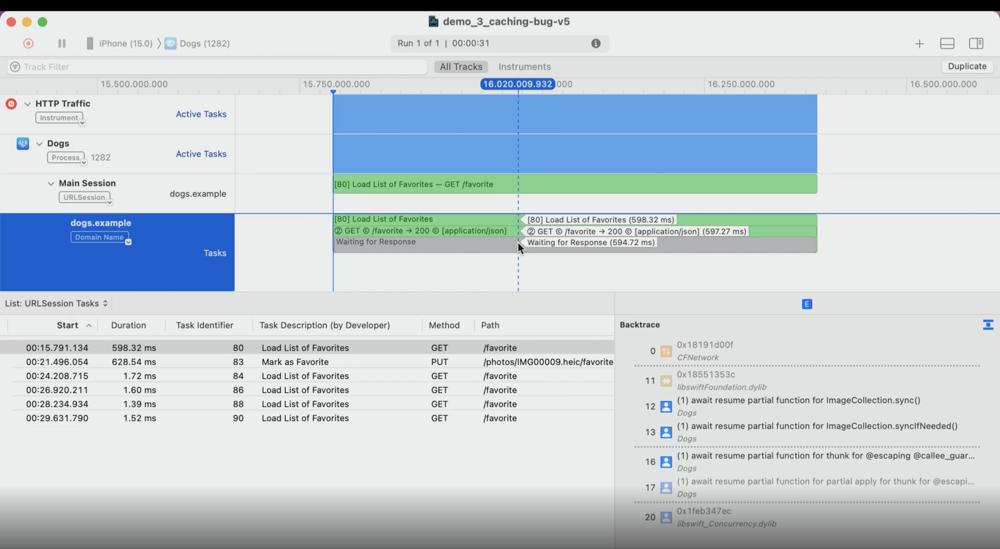
- Identify the backtrace (Ex: cached response)
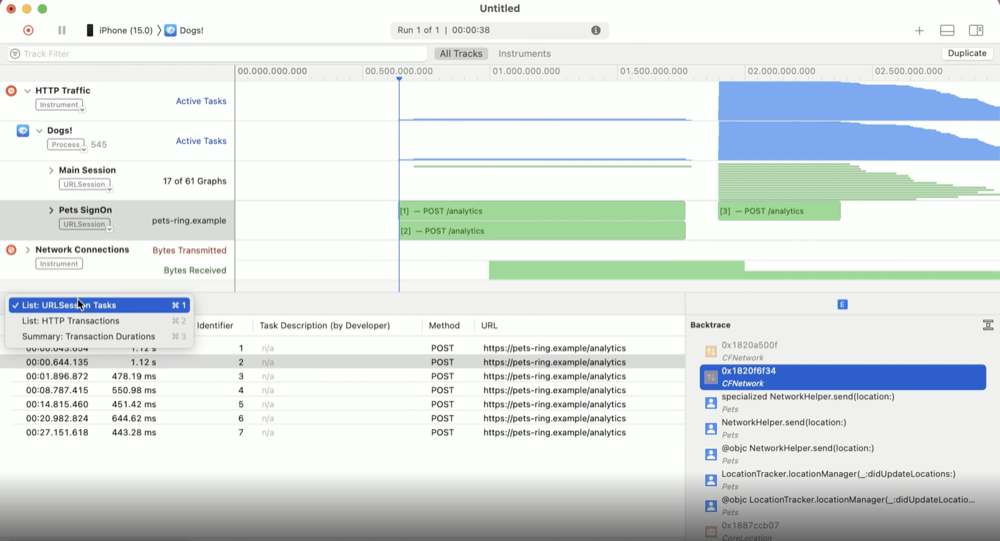
- Filter the session (Ex: Found an issue with the data that sent to server)
- Export the report to .har extension
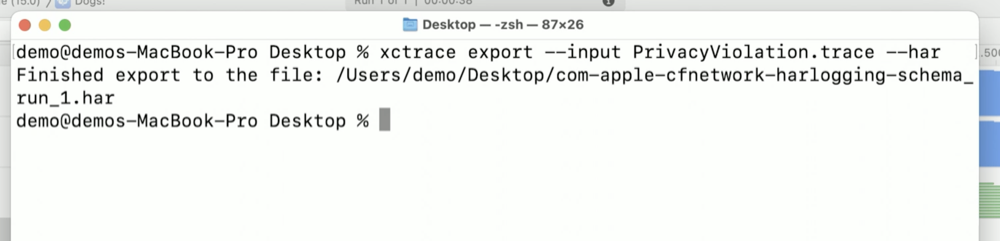
- Output
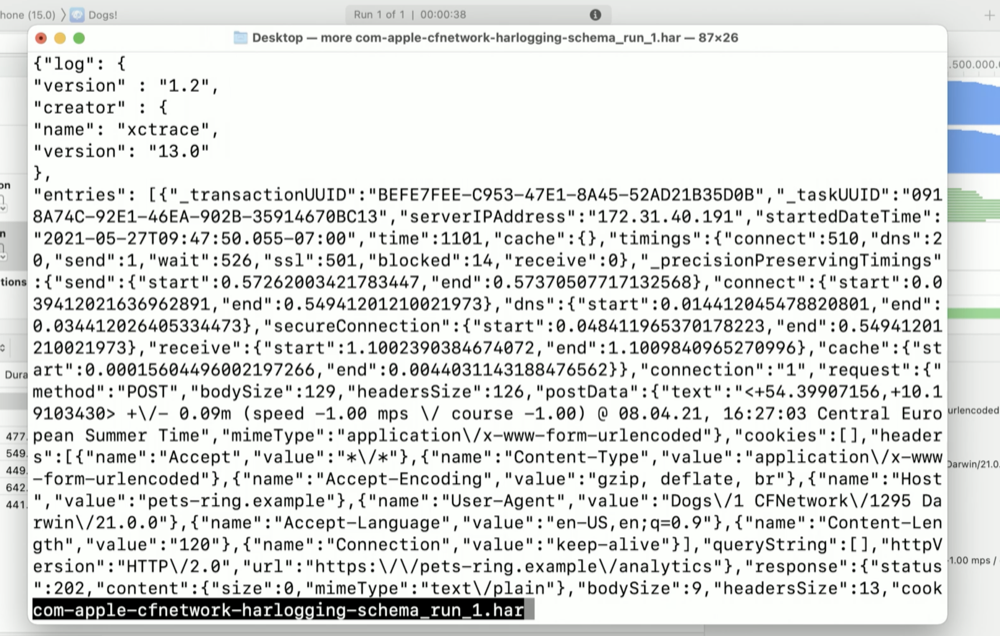
- Save and export report to .har to analyse issues
- .har is a JSON structure
Next Steps
- Target app today to detect problems
- Name your URL Session and URLSessionTask for easier debugging
- Adopt latest networking protocols
- Audit your app requests to check if can send less information
 Twitter
 GitHub
 michaelabadi.com